Correlation and linear regression
Predict in the right direction · Diagrams
Interpolation and extrapolation
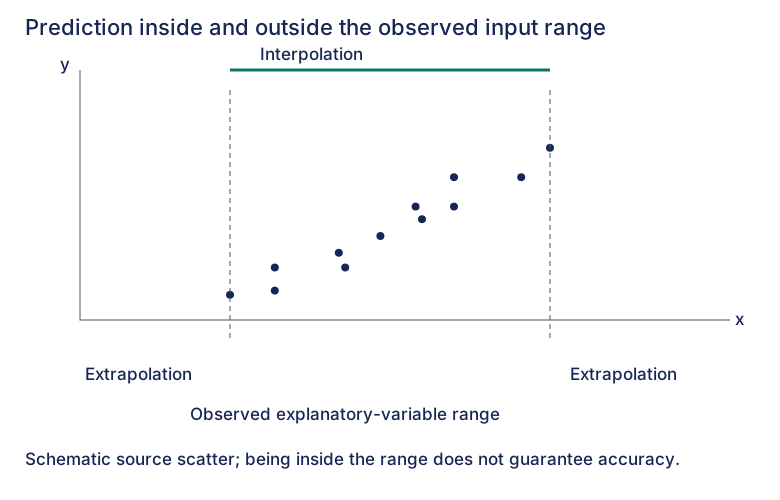
For direct prediction of a response y from an explanatory input x, compare the input with its observed range. This source illustration is schematic and supplies no numerical observations.
Below the observed inputs
Extrapolation. The explanatory input is smaller than every input observed in the sample.
Within the observed input range
Interpolation. The input lies between the smallest and largest observed inputs, including the limits.
Above the observed inputs
Extrapolation. The explanatory input is larger than every input observed in the sample.
- Check the explanatory-variable range. For a y-on-x prediction, compare the known x input with its observed x range, rather than with the response y range.
- Being inside the range does not guarantee accuracy. Check that the scatter supports the model; two observations alone cannot establish an underlying linear relationship.
- Keep the population and measurement context relevant. A strong correlation within a sample does not establish that the relationship continues outside the observed inputs.
Compare with the source range sketch
Expand diagramFit diagram to page
Use the scrollbars or arrow keys to inspect details.