Porisma
Back to reading

Discrete random variables

Discrete random variables · Diagrams · Complete reading

Choose another diagram

A running average from the printed coin experiment

Expand diagram

Use the scrollbars or arrow keys to inspect details.
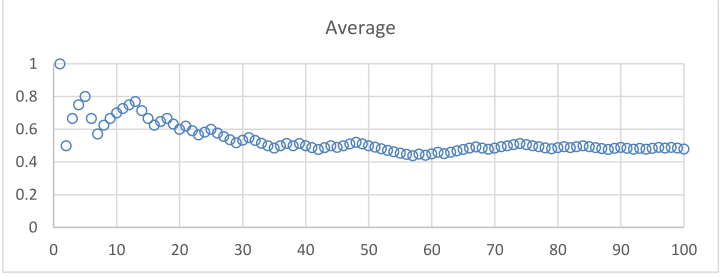
Teacher PDF 8 exact running-average plot: horizontal 0–100 tosses, vertical 0–1, one hundred open blue circles fluctuate early then settle near one half. Student copy has blank axes. Source points preserved rather than simulated.
Open original diagram (new tab)

The same centre with different spreads

Expand diagram

Use the scrollbars or arrow keys to inspect details.
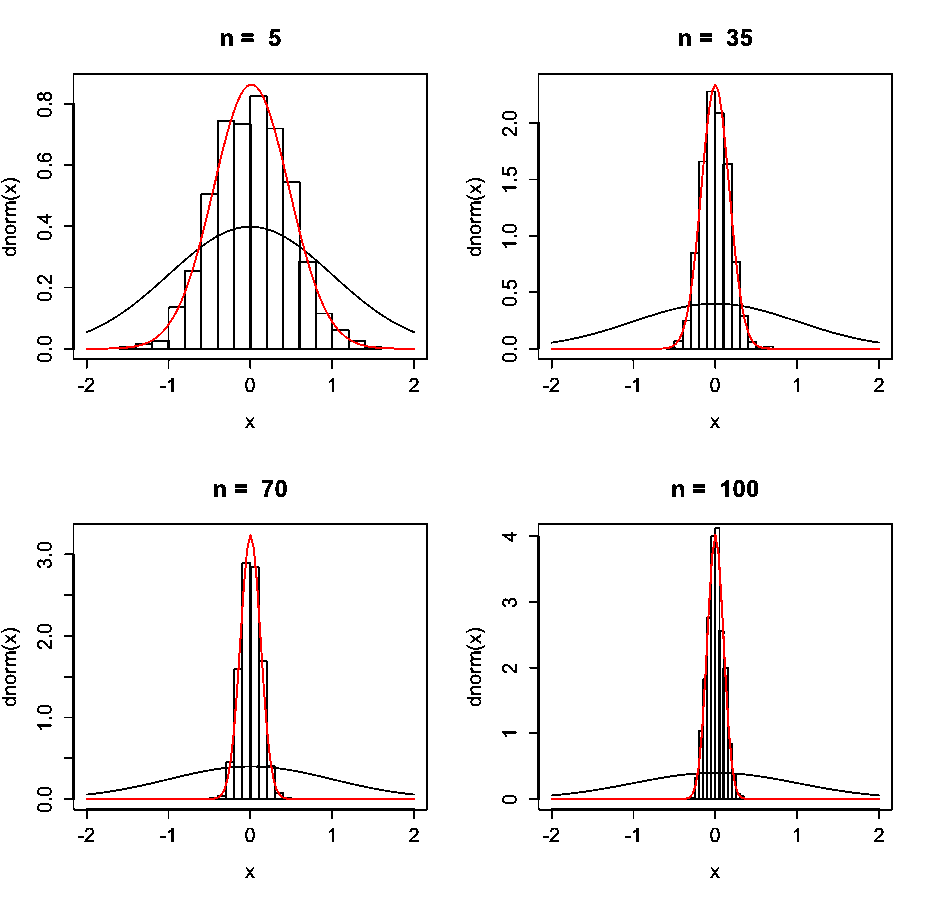
Four source panels traced as native SVG: n=5,35,70,100, each centred at 0 with x ticks −2,−1,0,1,2; histogram, red narrow curve and broad black curve retained. Vertical label dnorm(x); labelled ticks are 0,.2,.4,.6,.8 for n5;0,.5,1,1.5,2 for n35;0,1,2,3 for n70;0,1,2,3,4 for n100. Compare horizontal spread, not heights across different scales. Printed attribution: University of Pennsylvania.
Open original diagram (new tab)
Back to reading