Porisma
Back to reading

Hypothesis tests for a mean

Use a p-value · Diagrams · Complete reading

Choose another diagram

Observed tail probabilities

Expand diagram

Use the scrollbars or arrow keys to inspect details.
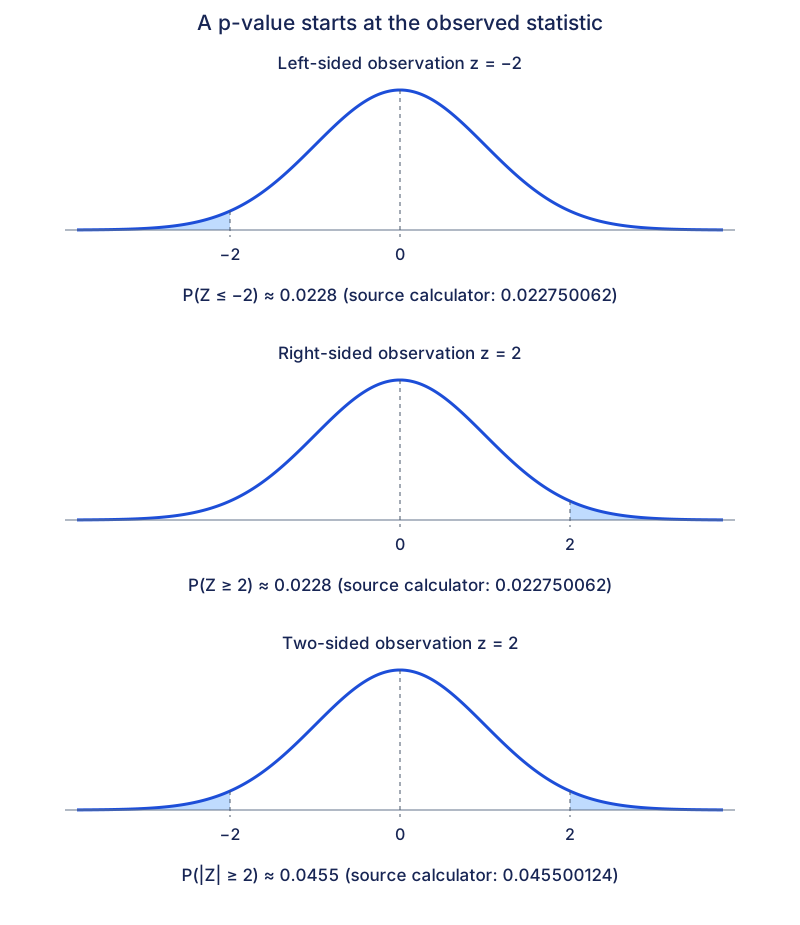
Three normal curves show observed tails beyond −2, beyond 2, and beyond both −2 and 2. One-sided probability is 0.0228; the two-sided total is 0.0455.
Open original diagram (new tab)

Compare p-values and critical values at 5%

Expand diagram

Use the scrollbars or arrow keys to inspect details.
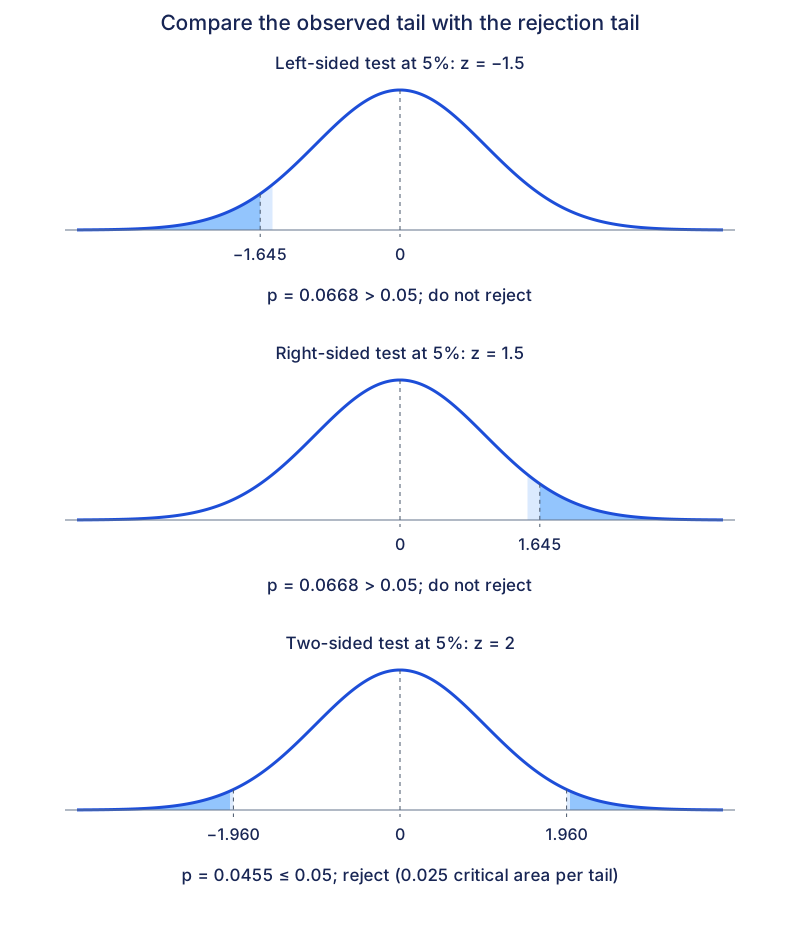
For observations −1.5 and 1.5, the one-sided p-value 0.0668 exceeds 0.05, so do not reject. For two-sided z=2, p=0.0455 and |z|>1.960, so reject. Darker shading marks the probability beyond the observation.
Open original diagram (new tab)
Back to reading