Porisma
Back to reading

Hypothesis tests for a mean

Use a critical region · Diagrams

Critical regions: allocate the significance level

Expand diagram

Use the scrollbars or arrow keys to inspect details.
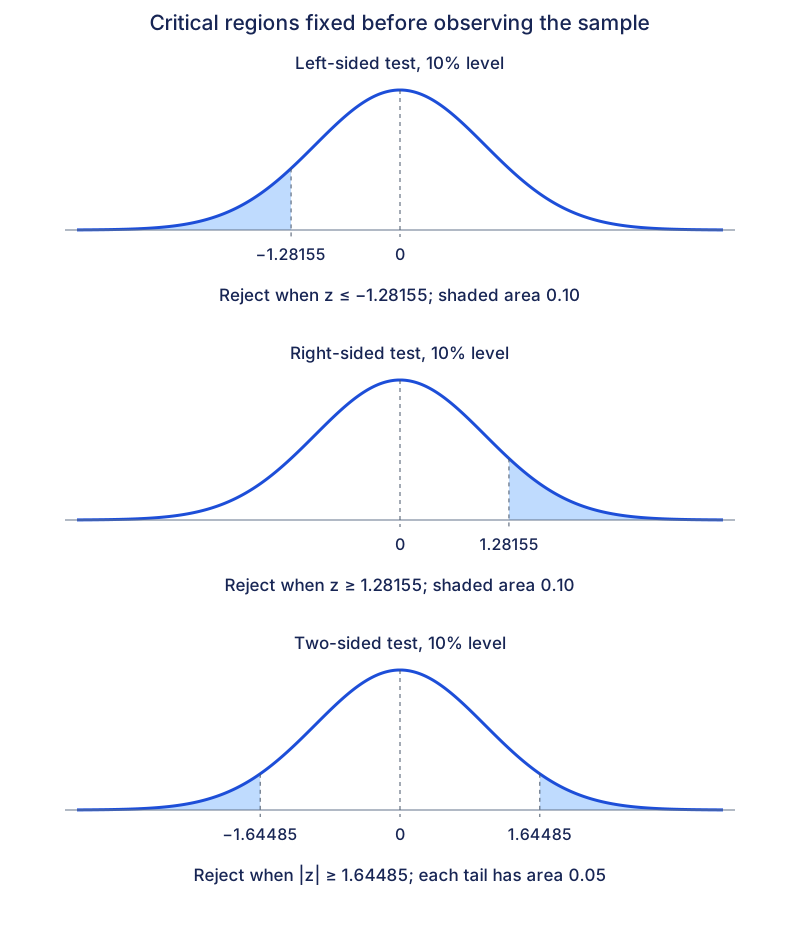
Three normal curves show 10% on the left below −1.28155, 10% on the right above 1.28155, and 5% in each tail beyond ±1.64485 for a two-sided 10% test.
Open original diagram (new tab)
Back to reading