Porisma
Back to reading

Sampling and the sample mean

Model a sample mean · Diagrams

Compare all five sampling distributions

Expand diagram

Use the scrollbars or arrow keys to inspect details.
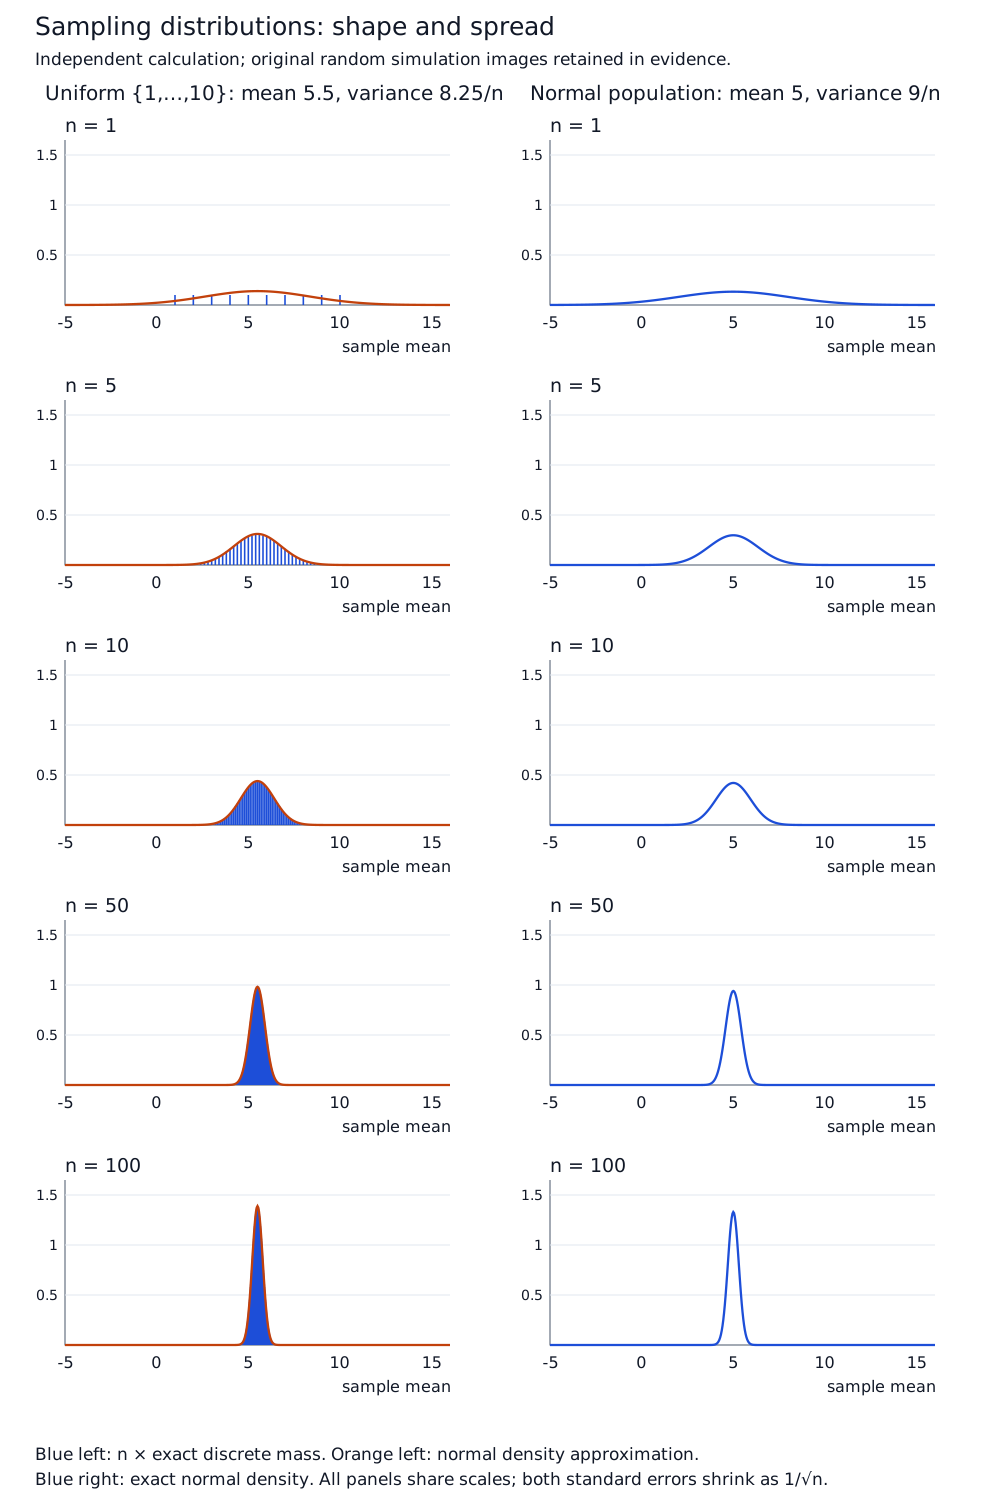
Five rows compare n=1, 5, 10, 50 and 100. Left: exact means of iid uniform integers 1–10, centre 5.5 and variance 8.25/n, with an orange normal approximation. Right: exact normal means with centre 5 and variance 9/n. All panels share horizontal −5–16 and density 0–1.5 scales; discrete mass is multiplied by n for comparison. The flat n=1 uniform distribution becomes bell shaped; normal means are normal at every n. Both spreads shrink. Independent mathematical reconstruction; original source simulation images are retained separately.
Open original diagram (new tab)
Back to reading