Worked solution
Find one mode or two exactly tied modes
In a village with a large population, 80% of inhabitants have a particular eye disorder. (i) If 12 people wait to see the nurse, find the most likely number with the disorder. (ii) If 19 people wait, find the most likely number.
CJC · Lecture · Example 10
(i) Search the twelve-person probability table
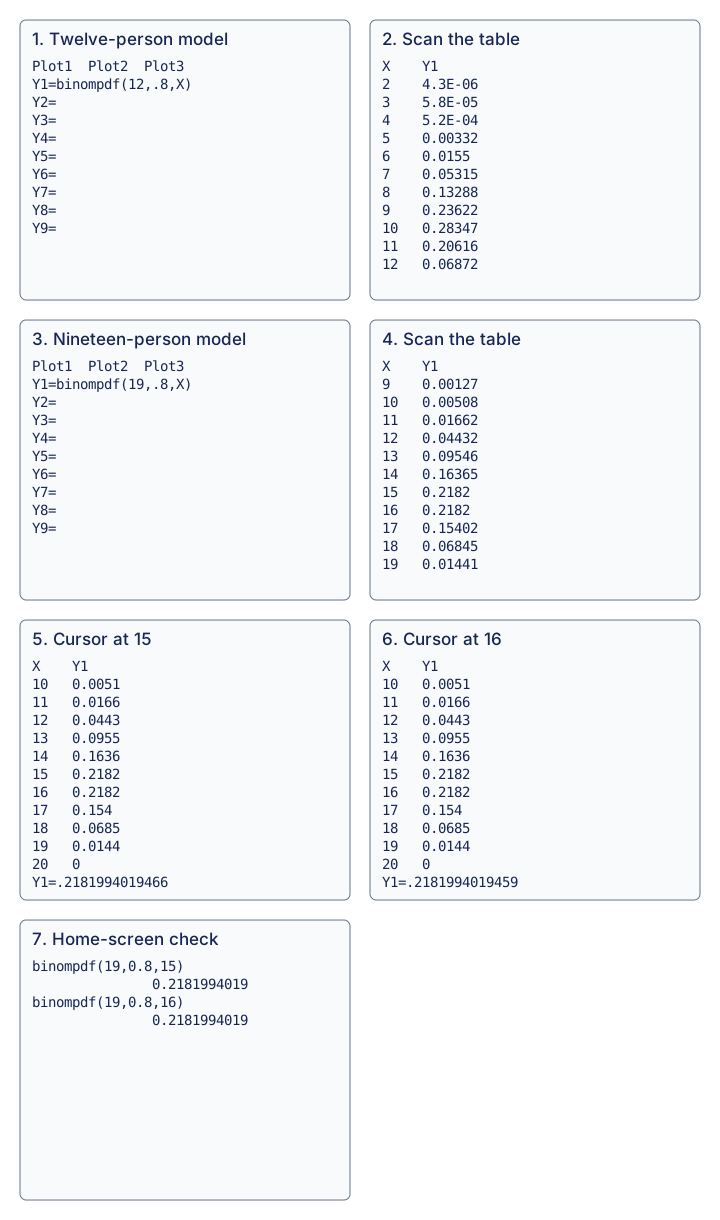
Let X count affected people among 12. Under the source constant-p independent-person model, . Enter Y1=binompdf(12,0.8,X), press 2nd, GRAPH, and scan the probabilities over the count support. The source retains these neighboring values, with a Teacher note to present this table:
| x | |
|---|---|
| 9 | 0.23622 |
| 10 | 0.28347 |
| 11 | 0.20616 |
The largest probability is at 10, so 10 people is the most likely count.
(ii) Retain both nineteen-person maxima
Let Y count affected people among 19, with . Enter Y1=binompdf(19,0.8,X), press 2nd, GRAPH, and scan for the maximum. The Teacher completes the table and both answer blanks:
| y | |
|---|---|
| 14 | 0.16365 |
| 15 | 0.2182 |
| 16 | 0.2182 |
| 17 | 0.15402 |
Both 15 and 16 are most likely.
Distinguish numerical noise from exact equality
The source self-reading note reports table readings 0.2181994019466 at 15 and 0.2181994019459 at 16, differing in the 12th/13th decimal places. The home screen prints 0.2181994019 for both, agreeing to 10 decimal places. Do not infer exact equality merely from nearly equal rounded output; retain the source formula check: . Thus the masses really are equal. The source’s practical advice to treat tiny table differences as numerical noise is justified here by this exact ratio, rather than as a universal equality test.
Compare your sketch
Find one mode or two tied modes
1. Scan the twelve-person model
Enter Y1=binompdf(12,0.8,X), then press 2nd → GRAPH. X is the outcome count. Compare the largest mass with its neighbours.
Scan the twelve-person model Count Displayed probability 9 0.23622 10 0.28347 11 0.20616 Twelve-person model: mode = 10
2. Repeat for nineteen people
Change Y1 to binompdf(19,0.8,X) and inspect the table.
Repeat for nineteen people Count Displayed probability 14 0.16365 15 0.2182 16 0.2182 17 0.15402 Nineteen-person model: modes = 15 and 16
3. Verify the tie exactly
The source cursor values end in different tiny digits. Home-screen binompdf(19,0.8,15) and binompdf(19,0.8,16) both display 0.2181994019. The exact probability ratio is 3876(0.2) / [969(0.8)] = 1.
Nearly equal rounded displays alone do not prove an exact tie. Here the ratio establishes equality. Search for the largest probability mass rather than rounding the mean; all original tables and cursor readings remain available below.
View original calculator screens
Expand diagramFit diagram to page
Use the scrollbars or arrow keys to inspect details.
Common mistakes
A tiny calculator difference is not proof of unequal modes; verify a tie algebraically.