Worked solution
Use a unique mode to bound p, then sketch a different distribution
Five people are sampled from a large village. (i) X counts those who are underweight; state in context an assumption needed for a binomial model. (ii) The village proportion underweight is p, and the mode of X is 2. Show that . (iii) Given instead , sketch its distribution.
[2017/DHS/II/9(modified)]
CJC · Lecture · Example 11
(i) State a contextual assumption
The source accepts either: the probability that a chosen person is underweight remains constant throughout the sample, or whether a chosen person is underweight is independent of whether other people are underweight. The full binomial model needs both constant p and independent trials; this part asks for one assumption in context.
(ii) Compare the mass at one with the mass at two
The strict bounds requested by the source interpret 2 as the unique mode. Then , so . A mode at 2 rules out p=0 or p=1; therefore and . Cancel positive factors to obtain , hence .
(ii) Compare the mass at two with the mass at three
Also , giving . Cancel positive factors to get , hence . This is the distinct Teacher completion. Together , as required. If 2 were merely one of possibly tied modes, the endpoints would be included: at p=1/3 modes 1 and 2 tie, and at p=1/2 modes 2 and 3 tie.
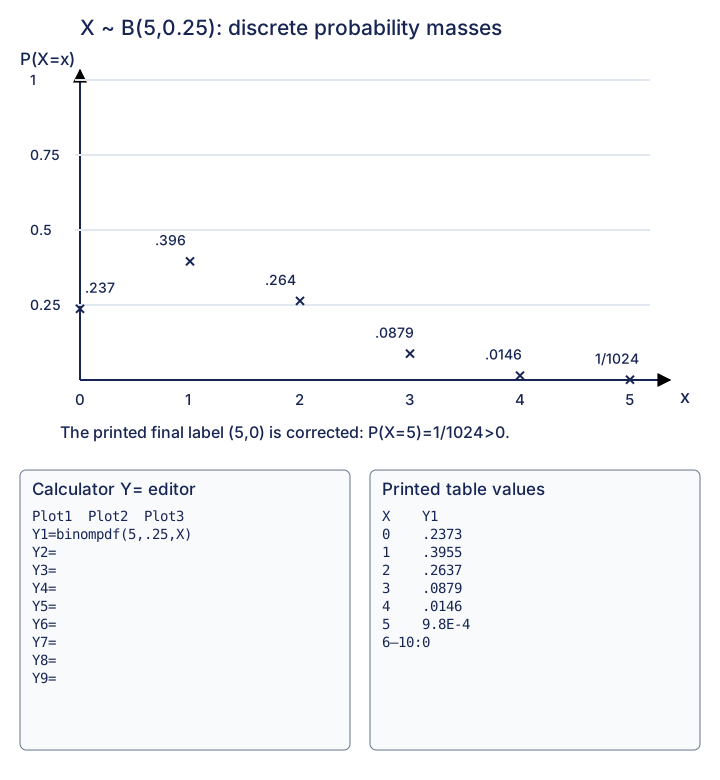
(iii) Sketch the six probability masses
This part gives a different parameter p=0.25; do not carry the range from (ii) into it. Use Y1=binompdf(5,0.25,X) and its table. The exact masses are
| x | |
|---|---|
| 0 | |
| 1 | |
| 2 | |
| 3 | |
| 4 | |
| 5 |
Plot separate points/crosses at 0 through 5. The source labels the first five heights approximately 0.237,0.396,0.264,0.0879,0.0146. Its final label (5,0) is inaccurate: , consistent with the source calculator’s 9.8E−4. The native sketch corrects this positive final mass; the original printed plot and text remain in source evidence. The mode of this new distribution is 1.
Compare your sketch
Expand diagramFit diagram to page
Use the scrollbars or arrow keys to inspect details.
Common mistakes
Strict mode bounds assume a unique mode; a very small probability is still positive.