Worked solution
Fit a straight line to logarithms of both variables
A researcher gave eight children lists of words of varying difficulty and asked each child to define them. The ages (years) and numbers of correctly defined words are:
| Child | ||
|---|---|---|
| A | 2.5 | 9 |
| B | 3.1 | 13 |
| C | 4.3 | 18 |
| D | 5.0 | 25 |
| E | 5.9 | 35 |
| F | 7.1 | 53 |
| G | 8.1 | 81 |
| H | 9.4 | 132 |
(i) Sketch the scatter diagram and comment on whether a linear regression of on is suitable.
(ii) Calculate the product moment correlation coefficient between and . Comment on the suitability of .
(iii) Find the least-squares regression of on . Sketch it on the scatter diagram of against .
CJC · Lecture · Example 10
(i) Inspect the original scale
Answer
A straight-line model is unsuitable for the visibly curved original pattern.
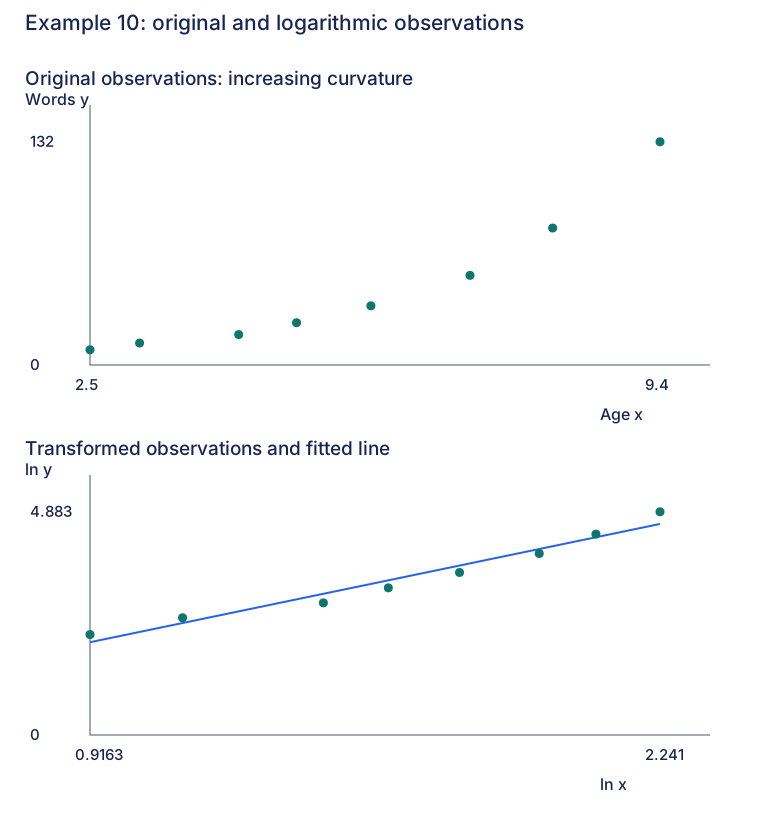
Plot all eight pairs, age horizontally and correctly defined words vertically. The source marks input extremes 2.5 and 9.4 and output extremes 9 and 132. The points rise increasingly steeply, rather than scattering about a straight line. This completes the source’s blank suitability comment. The original lower-left O is a cropped sketch corner; the reconstruction labels the actual input ticks.
(ii) Generate logarithmic lists and assess the fit
Answer
(3 s.f.); the transformed pattern supports a linear model.
Keep in L1 and in L2. Highlight L3, press ENTER, enter L3=ln(L1) and ENTER. Highlight L4, press ENTER, enter L4=ln(L2) and ENTER. The source screen displays, for example, and . Both variables must be positive for these real logarithms.
Use STAT → CALC → 8:LinReg(a+bx), Xlist=L3, Ylist=L4, Store RegEQ=Y1. Calculator x represents and calculator y represents . The printed output is , , , , reported as . The transformed scatter is approximately linear with strong positive association, supporting the proposed form; the blank suitability explanation is authored. A large coefficient alone does not establish validity outside this sample.
(iii) Plot the regression in transformed coordinates
Answer
(3 s.f.).
The full printed fit is . Use Plot1 ON, scatter type, Xlist=L3, Ylist=L4, with the regression already stored in Y1. The source sketch labels , , and ; both logarithmic axis labels must be retained.
The reconstruction draws the full-precision line through the exact logged observations. Its caption can report the requested 3-s.f. coefficients without using those rounded values for later calculations. In original units this is the power-law model , not an exponential in ; this last equivalence is an authored clarification.
Compare your sketch
Expand diagramFit diagram to page
Use the scrollbars or arrow keys to inspect details.
Solution notes
All eight pairs, all three asks, two source scatter roles, logarithmic list generation, variable mapping, StoreY1 and plot settings retained. Suitability comments complete visible blanks and are labelled authored. No printed marks.