Worked solution
Compare two scatters and fit both regression directions
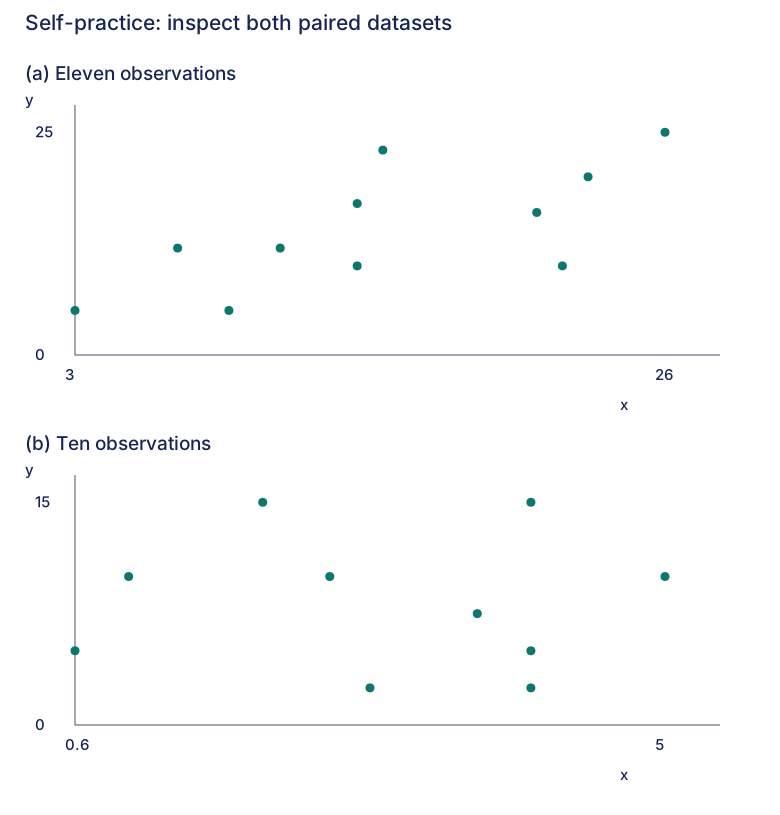
For each dataset, find (i) the correlation coefficient and comment on how it relates to the shape of the scatter diagram, (ii) the regression of on , and (iii) the regression of on .
(a)
| 3 | 5 |
| 7 | 12 |
| 9 | 5 |
| 11 | 12 |
| 14 | 10 |
| 14 | 17 |
| 15 | 23 |
| 21 | 16 |
| 22 | 10 |
| 23 | 20 |
| 26 | 25 |
(b)
| 0.6 | 5 |
| 1 | 10 |
| 2 | 15 |
| 2.5 | 10 |
| 2.8 | 2.5 |
| 3.6 | 7.5 |
| 4 | 2.5 |
| 4 | 5 |
| 4 | 15 |
| 5 | 10 |
CJC · Lecture · Self-practice
(a)(i) Interpret the first scatter
Answer
(3 s.f.).
The eleven paired points have a positive but visibly scattered linear trend. They are not all close to a perfect line, matching a coefficient between 0 and 1. The source prints ; the scatter comment and plot are authored from the exact pairs. The unrounded check is .
(a)(ii) Regress y on x
Answer
.
Use the first coordinates as explanatory and the second as response: Xlist contains , Ylist contains . The printed coefficients agree with independently calculated intercept and slope , rounded to 3 s.f.
(a)(iii) Regress x on y
Answer
.
Swap the explanatory and response lists. The printed reverse coefficients agree with intercept and slope . This is a new least-squares fit, not an algebraic inversion of the preceding equation.
(b)(i) Interpret the second scatter
Answer
(3 s.f.).
The ten paired observations show almost no overall linear trend. The coefficient is very slightly negative and close to zero; this does not prove statistical independence or rule out every nonlinear relationship. Preserve all three distinct observations with . The source prints ; the scatter explanation and plot are authored. The unrounded check is .
(b)(ii) Regress y on x
Answer
.
The printed line agrees with independently calculated intercept and slope . Its very shallow negative gradient matches the near-zero linear correlation.
(b)(iii) Regress x on y
Answer
.
The printed reverse line agrees with independently calculated intercept and slope . Both negative slopes have the same sign as , but neither is a measure of correlation strength on its own.
Compare your sketch
Expand diagramFit diagram to page
Use the scrollbars or arrow keys to inspect details.
Solution notes
Both complete printed datasets, all six numerical answers, and the additional scatter-comment asks retained. Working and scatter explanations authored and checked independently; no Teacher counterpart or printed marks.