Worked solution
Transform a mean and variance
Calculate the mean and variance of , where has distribution
| 0 | 1 | 2 | 3 | |
|---|---|---|---|---|
CJC · Lecture · Example 13
Read the population statistics from the calculator
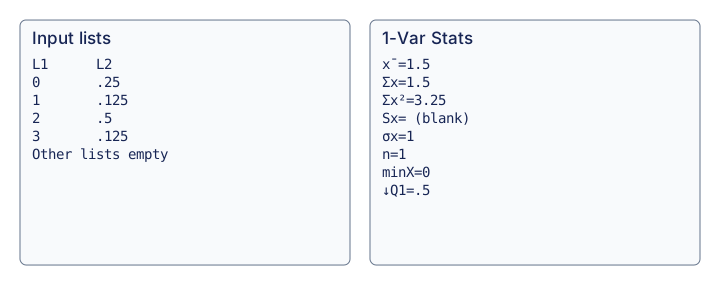
Use the same probability-weighted 1-Var Stats workflow: values in L1 and weights in L2. Both source screens give and , so . The other displayed values are , , total weight , minX=0 and Q1=0.5, with Sx blank.
Transform the mean
.
Transform the variance
. The shift by three changes the centre but not the spread.
Compare your sketch
Check a second probability-weighted distribution
1. Enter outcomes and probabilities
In STAT → EDIT, place the outcomes in L1 and their probabilities in L2.
Enter outcomes and probabilities L1 · outcome L2 · probability 0 0.25 1 0.125 2 0.5 3 0.125 2. Calculate the weighted statistics
Open STAT → CALC → 1-Var Stats. Use List=L1 and FreqList=L2, then Calculate.
Mean x̄ = 1.5; population σx = 1
3. Interpret the variance
Square the stored population standard deviation. The variance is 1. An independent check is 3.25 − 1.5² = 1.
The source n=1 is the total probability weight. Use population σx rather than sample Sx; the original source leaves Sx blank. Apply any later linear transformation to this distribution as specified in the question.
View original calculator screens
Expand diagramFit diagram to page
Use the scrollbars or arrow keys to inspect details.
Common mistakes
Multiply the variance by the square of the scale factor. Do not add 3 to the variance. The displayed sigma 1 is a standard deviation and must be squared to obtain Var(X)=1.