Worked solution
Assess Alice’s claim about mean mass
Suppose the mass of a man in Singapore is assumed to be normally distributed with mean 75 kg and variance . 100 men are randomly selected from the population and their sample mean mass is 77.2 kg. Alice claims that the population mean mass is actually more than 75 kg. Conduct a hypothesis test at the 5% level of significance.
CJC · Lecture · Opening scenario (unnumbered)
Define the model and hypotheses
Let be a randomly selected man’s mass in kg and the population mean. Test against . Under , and . Normality and known variance make this sampling distribution exact; no CLT approximation is needed.
Calculate the observed upper-tail probability
The standard error is kg, not 80 or . Thus and . The source displays but retains the p-value from the unrounded input; keep full precision until the final result.
Compare with the preselected significance level
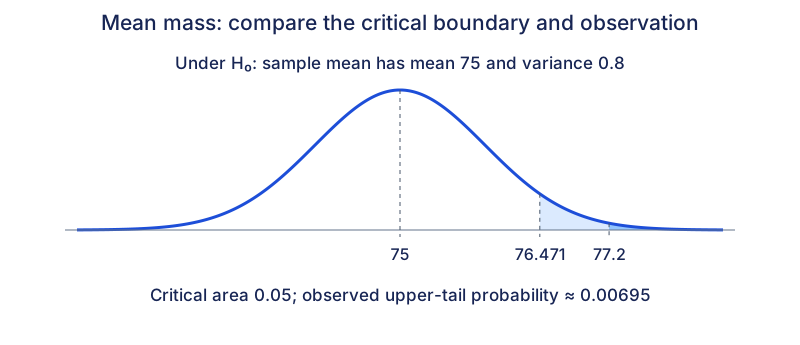
Reject if . Here , so reject : there is sufficient evidence at the 5% level that the population mean mass exceeds 75 kg. Under the null, repeated random samples of 100 have probability about 0.00695 of a mean at least 77.2 kg. This is not a probability that the null is true.
Check the same decision using a critical boundary
The source’s calculator uses inverse normal with upper-tail area 0.05, mean 75 and standard deviation : . The source writes the critical region ; the observed 77.2 is inside it. Using the inclusive boundary convention gives the same decision; boundary equality has zero probability in this continuous model.
Compare your sketch
Expand diagramFit diagram to page
Use the scrollbars or arrow keys to inspect details.
Common mistakes
The hypothesised mean 75 and observed sample mean 77.2 play different roles. A small p-value does not prove the claim.
Solution notes
Original source scenario is unnumbered and recurs across the lecture; source number 0 is a stable internal identity, not a printed Example 0. Teacher hypotheses and completed probability calculation are integrated. Calculator artwork is not reproduced.