Worked solution
Read the same interval from a parabola and a sign line
Find the range of values of x such that .
CJC · Lecture · Example 1
Method 1: graph the polynomial
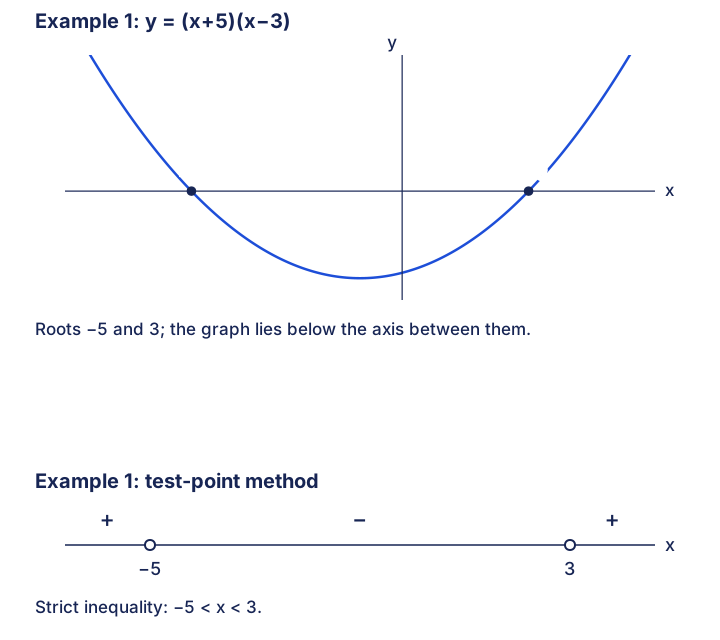
. The roots are x=−5 and x=3. Negative polynomial values mean the graph lies below the x-axis, which occurs for −5<x<3.
How did this part go?
Method 2: test between critical values
Factor . Mark its zeros −5,3 and test convenient inputs in , and ; for example −6,0,4 give positive, negative, positive values. Hence −5<x<3. The source test-point paragraph accidentally writes ; test the original instead, consistent with its roots and final answer.
How did this part go?
Compare your sketch
Expand diagramFit diagram to page
Use the scrollbars or arrow keys to inspect details.
Common mistakes
Strict inequalities exclude zero-valued endpoints. The misprinted test expression has different roots; use the original factors.