Worked solution
Use a difference graph, two graphs or a factored sign line
Find the set of values of x satisfying .
CJC · Lecture · Example 3
Method 1: one difference graph
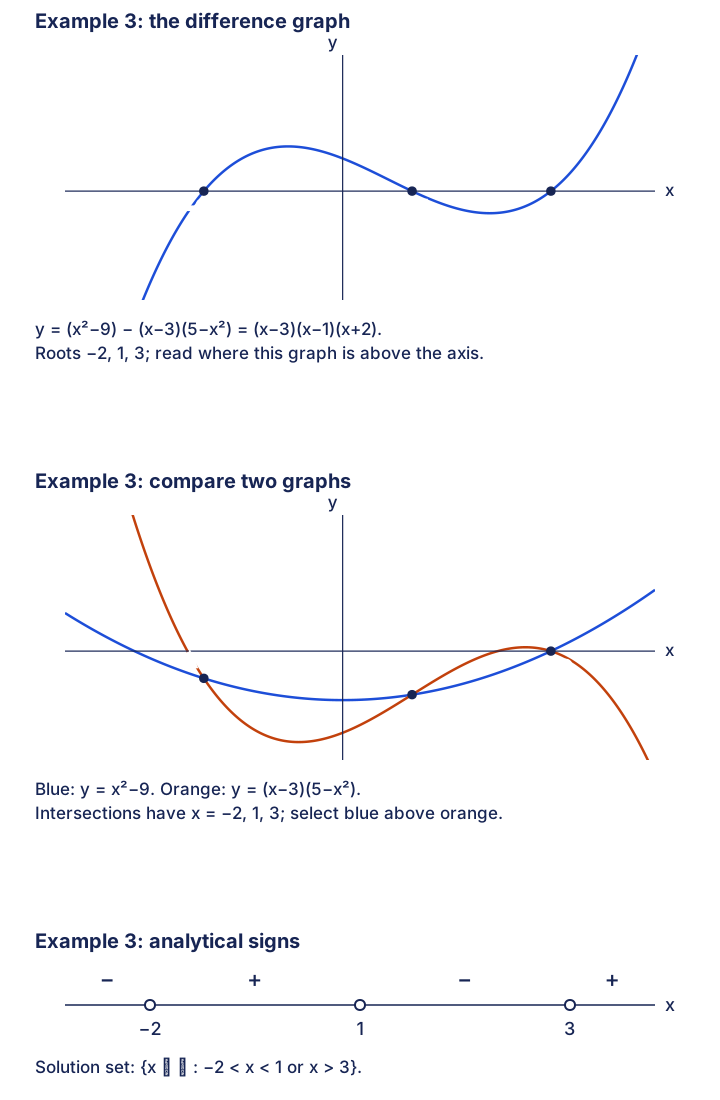
Move the right side to the left: . The difference graph has roots −2,1,3. It is above the x-axis for −2<x<1 or x>3.
Method 2: compare the two original graphs
Sketch y=x²−9 and . They intersect at x=−2,1,3. Select the intervals where the first graph is above the second: −2<x<1 or x>3.
Method 3: factor before testing signs
becomes , then , hence . Signs between −2,1,3 are −,+,−,+. Thus the solution set is .
Keep equivalent representations and avoid an invalid cancellation
The source’s Equivalence note connects algebraic and graphical representations: all three methods describe the same input set. Its speech bubble asks whether x−3 can simply be divided out. It cannot be cancelled without cases: x−3 has unknown sign, and dividing reverses the inequality for x<3. At x=3 the original strict inequality is false. The source asks for a set, so present the result in set notation; its remarks allow inequality, interval or set notation for a request phrased as a range.
Compare your sketch
Expand diagramFit diagram to page
Use the scrollbars or arrow keys to inspect details.
Common mistakes
Dividing by x−3 without considering its sign changes the solution set. Set notation is the requested presentation here.