Worked solution
Sketch two parameterised curves with their full allowed ranges
Sketch (a) , , ; (b) , , .
CJC · Lecture · Example 2
(a) Locate the intercept and both branches
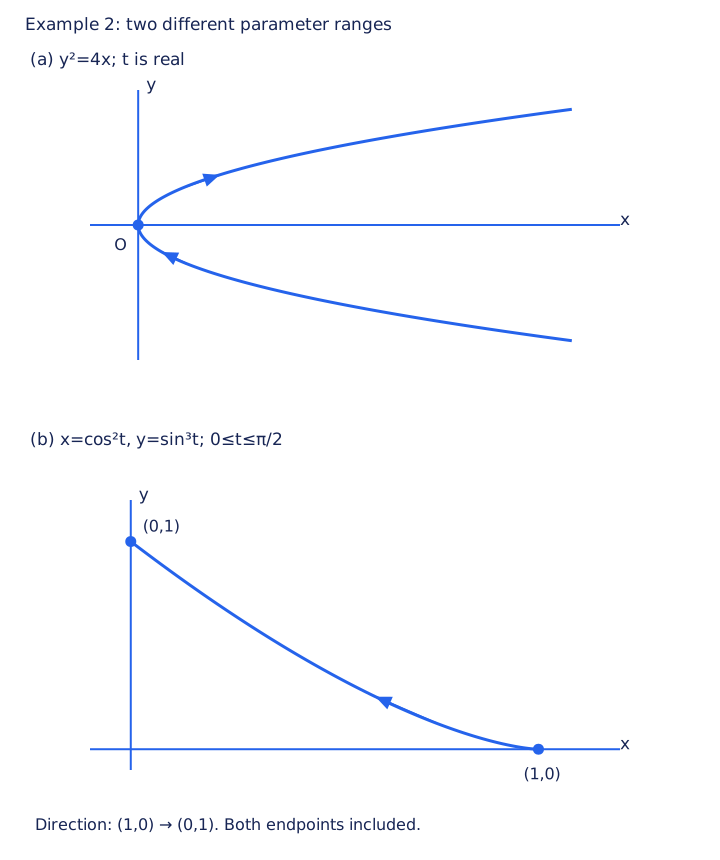
At , and ; at , again . Eliminating t gives , a right-opening parabola with vertex and both positive and negative y branches. As t increases, it runs along the lower branch to the origin and then along the upper branch. The source calculator example uses to display a finite representative portion, not the complete infinite parabola.
(b) Preserve the quarter-interval endpoints
At , , giving ; at , , giving . Since both sine and cosine are nonnegative on the interval, for . The curve runs from to as t increases. It has horizontal tangent at and limiting slope at ; the source is a schematic, not a claim of a vertical tangent there.
Compare your sketch
Expand diagramFit diagram to page
Use the scrollbars or arrow keys to inspect details.
Common mistakes
A finite calculator window cannot establish an unrestricted real-parameter curve is bounded.