Worked solution
Refit a logarithmic model after finding a recording error
The human resource department of a company is tasked to determine if there is a relationship between the age and cholesterol level of their staff. The following table shows the information on age, years, and cholesterol level, milligrams per deciliter of blood, mg/dL, for a random sample of 10 members of staff.
| Age, (years) | 38 | 64 | 39 | 34 | 25 | 46 | 37 | 26 | 55 | 31 |
|---|---|---|---|---|---|---|---|---|---|---|
| Cholesterol level, (mg/dL) | 205 | 225 | 206 | 192 | 150 | 213 | 190 | 165 | 220 | 181 |
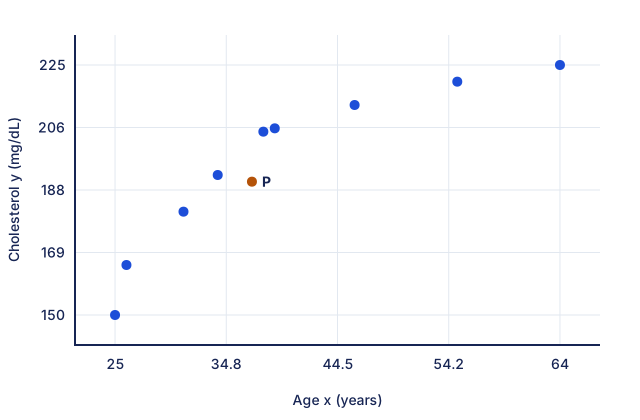
(i) Draw a scatter diagram for the data. mark
(a) Explain why, in this context, a quadratic model would probably not be appropriate for long term predictions. mark
(b) Explain why the diagram shows that the data may be consistent with the model of the form . mark
One of the values of is recorded wrongly. Indicate the corresponding point on your diagram by labelling it P. mark
Omitting P, use the data for the remaining workers to answer the following questions.
(ii) Calculate the product moment correlation coefficient between and . mark
(iii) Calculate the least squares estimates of and , for the model . marks
(iv) Assume that the value of at P is correct. Estimate the value of for this value of . marks
(v) If the cholesterol levels in the above table were recorded in micrograms per litre of blood instead, state whether your answer in (ii) will be different. mark
(vi) The manager wishes to estimate the cholesterol level for an employee who is 22 years old. Comment on the reliability of the estimate. mark
[2013/ACJC/II/12]
CJC · Review problems · Question 3
Answer
P is . After omitting P: , , , corrected estimate mg/dL. Positive unit conversion leaves unchanged; age 22 requires unreliable extrapolation.
(i) Scatter, models and point P
Plot the ten pairs and label P at , as in the source sketch. Apart from this point, the increasing pattern bends downwards. A concave-down quadratic fit would eventually predict decreasing levels as age increases; this makes that long-term extrapolation inappropriate in the source context. An increasing logarithmic model with has an increasing value and a decreasing gradient, matching the observed shape. This is a modelling argument for these data, not a universal claim about age and cholesterol.
(ii) Transform after omitting P
Remove , then calculate the correlation of the remaining nine and values: .
(iii) Least-squares coefficients
Regress on : . Thus and (3 s.f.).
(iv) Replace the incorrect value
Keeping , use the unrounded fit: mg/dL (3 s.f.).
(v) Change the units
No change to : converting mg/dL to micrograms per litre multiplies every by the same positive constant, . Positive rescaling leaves the product-moment correlation unchanged.
(vi) Predict outside the sample
Age 22 lies below the observed age range , so the estimate is extrapolation and is not reliable on the evidence of this sample.
Compare your sketch
Expand diagramFit diagram to page
Use the scrollbars or arrow keys to inspect details.
Common mistakes
Do not compute the correlation with raw ages when the question asks for ln x. Model behaviour outside the data range needs a separate contextual judgement.
Solution notes
The plotted source point P is (37,190). The source’s quadratic argument is retained as a qualification of a concave-down fit, not a general assertion about every quadratic or a medical prediction.