Worked solution
Transform PSI and recover an additional observation
A study comparing the number of hotspots detected in Indonesia each day and the average 24-hour PSI reading in Singapore was conducted. The results over 7 days were given below:
| Number of hotspots () | 50 | 97 | 128 | 150 | 170 | 189 | 215 |
|---|---|---|---|---|---|---|---|
| Average 24-hour PSI reading () | 45 | 98 | 160 | 205 | 263 | 341 | 400 |
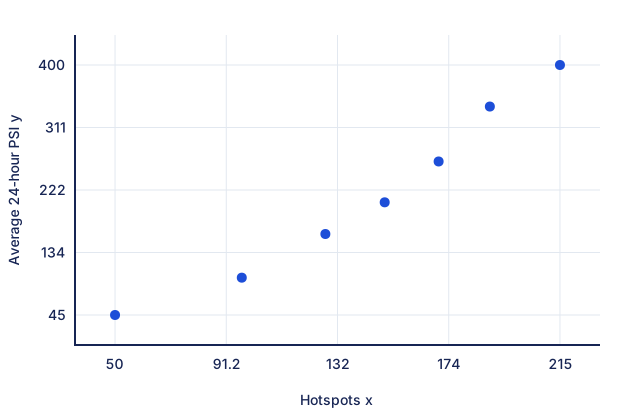
(i) Draw a scatter diagram and find the value of the product moment correlation coefficient between and . Hence comment on the suitability of the linear model. marks
(ii) Can we conclude that an increase in the number of hotspots will lead to an increase in the PSI reading? Explain your answer. mark
(iii) A few alternative models, in the form of , were proposed to describe the relation between and . State, with a reason, which model is the most appropriate.
Model A: ; Model B: ; Model C: . marks
It was decided that the data for an additional day should be included in the study. After inserting the data for the additional day, it was found that the equation of the regression line of on is and the equation of the regression line of on is based on the most appropriate model in part (iii).
(iv) Find the product moment correlation coefficient between and . mark
(v) Find the average 24-hour PSI reading on this additional day, correct to the nearest integer. marks
In estimating the number of hotspots when the average 24-hour PSI reading was , where , Tarzan used the regression line of on for the estimation and Jane used the regression line of on for the estimation. It was found that both of them had approximately the same answer. Explain why this was observed. mark
[2013/AJC/II/10]
CJC · Review problems · Question 4
Answer
Raw ; no causal conclusion. Model B (); new-data ; additional PSI .
(i) Raw scatter and correlation
Plot all seven pairs, with hotspots horizontally and PSI vertically. The points have a strong increasing association. . As in the source, a linear approximation is plausible within this range; the visible upward curvature motivates comparison with transformed models.
(ii) Association is not causation
No. Correlation alone does not establish that increasing hotspots causes the increase in Singapore PSI. Other factors, such as wind direction, could affect the reading.
(iii) Compare transformations
The correlations of with , and are , and . Model B has the coefficient closest to , so select .
(iv) Use the two regression slopes
The product of the regression slopes is . Both slopes are positive, so .
(v) Recover the missing transformed value
Both regression lines pass through . Solving the printed equations gives , . For the additional PSI , . Thus , or to the nearest integer.
Explain the two estimates
Because is very close to , the two fitted lines are nearly the same line in the plane. Their predictions are therefore close in this range, although regression of on is the appropriate direction when estimating hotspots from PSI.
Compare your sketch
Expand diagramFit diagram to page
Use the scrollbars or arrow keys to inspect details.
Common mistakes
Average sqrt(PSI), not PSI, when recovering the additional day. The source radical is essential.
Solution notes
The PDF visibly prints square roots in Model B, the r formula and the mean equation; native text extraction loses them. Restored from page images. Source intermediate rounding gives sqrt(Y)=15.478; unrounded printed-line arithmetic gives 15.47895955, with the same nearest-integer answer 240.