Worked solution
Fit a bounded growth model
A scientist is studying the growth of a bacteria colony in a petri dish. He places bacteria at one spot of the dish and he measures the area the bacteria cover on day . His results are recorded below:
| Time, (days) | 0 | 1 | 2 | 3 | 4 | 5 | 6 | 7 |
|---|---|---|---|---|---|---|---|---|
| Area, () | 1.00 | 5.00 | 27.10 | 41.39 | 46.95 | 49.95 | 51.07 | 52.05 |
(i) Draw a scatter diagram to illustrate the data. mark
(ii) The scientist would like to predict the future growth of the bacteria. Explain why, in this context, a linear model is not likely to be appropriate. mark
It is proposed to fit a model of the form , where is a suitable constant. The product moment correlation coefficient between and is denoted by . The following table gives values of for some possible values of .
| 53 | 54 | 55 | |
|---|---|---|---|
| −0.99132 | −0.98767 |
(iii) Calculate the value of for , giving your answer correct to 5 decimal places. Hence, explain which value of is the most appropriate. marks
(iv) With the value of in (iii), calculate the values of and correct to 5 decimal places, and use them to predict the area covered by the bacteria after 20 days. marks
(v) Give an interpretation, in context, of the value of . mark
[2013/CJC/II/11]
CJC · Review problems · Question 5
Answer
, ; , ; predicted area after 20 days .
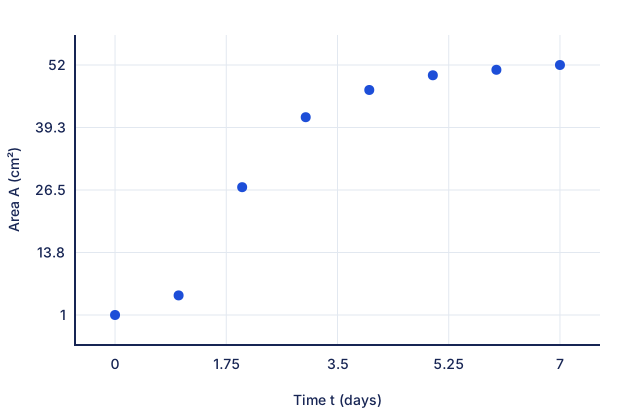
(i) Sketch the data
Plot time horizontally and area vertically using all eight pairs. The initially rapid increase levels off as the area approaches a limiting value; see the comparison sketch.
(ii) Use the physical constraint
A straight line with a positive slope would predict unbounded area as time increases. The petri dish has finite area, so such a model is inappropriate for long-term predictions.
(iii) Choose D
For , correlate and . This gives (5 d.p.). Of the three candidates, this is closest to , so is preferred.
(iv) Fit and predict
Regress on : , . To 5 d.p., , . Using these requested rounded coefficients, .
(v) Interpret the limiting value
Since , from below as . In the source context, represents the maximum available area of the petri dish.
Compare your sketch
Expand diagramFit diagram to page
Use the scrollbars or arrow keys to inspect details.
Common mistakes
53.0 is rounded: the fitted area remains below D. The day 20 prediction also extrapolates beyond the observed 0–7 days.
Solution notes
The printed solution repeats label(i) for the response to (ii); student working uses the intended part. Its “r closest to 1” alternative is |r| closest to 1 in the visual source, not positive r.