Worked solution
Choose the regression direction for an inverse prediction
A new drug developed to reduce a smoker’s reliance on nicotine may reduce one’s pulse rate to dangerously low levels. To investigate the drug’s effect on pulse rate, different dosages of the drug were administered to six smokers, and the decrease in each smoker’s pulse rate was recorded 30 minutes later.
| Smoker | 1 | 2 | 3 | 4 | 5 | 6 |
|---|---|---|---|---|---|---|
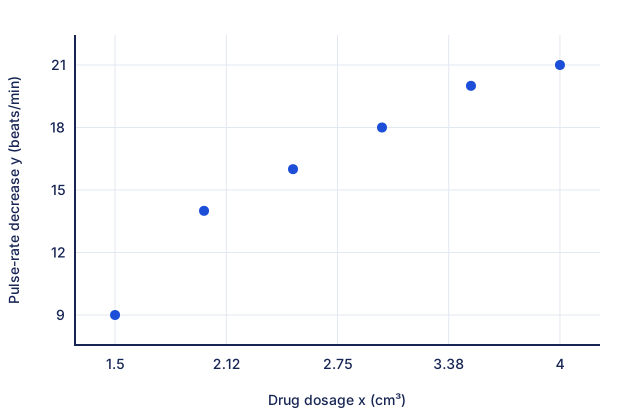
| Drug dosage () | 2.0 | 1.5 | 3.0 | 2.5 | 4.0 | 3.5 |
| Decrease in pulse rate ( beats per minute) | 14 | 9 | 18 | 16 | 21 | 20 |
(i) Draw a scatter diagram to illustrate the data. mark
(ii) Calculate the product moment correlation coefficient between and , and explain why its value does not necessarily mean that the best model for the relationship between and is . marks
(iii) It is proposed that the decrease in pulse rate can be modelled by the formula , where and are constants. Explain why this is a better model. mark
(iv) Calculate the least-squares estimates of and for the model in (iii). marks
(v) Use a regression line to give the best estimate that you can of the dosage of drug administered when the decrease in pulse rate is 25 beats per minute. Comment on the reliability of your answer. marks
[2013/NJC/II/9]
CJC · Review problems · Question 6
Answer
, ; , . Reverse-regression estimate: ; printed forward-model inversion: . Both are extrapolations.
(i) Scatter diagram
Plot all six pairs with dosage horizontally and pulse-rate decrease vertically. The increasing pattern bends downwards; see the comparison sketch.
(ii) Raw correlation
. A value close to 1 does not exclude curvature: the scatter indicates an increasing relationship with a decreasing gradient.
(iii) Logarithmic model
. The correlation of and is , closer to 1 than the raw value. This and the decreasing-gradient pattern support the transformed model.
(iv) Fit the model
Regress on to obtain . Therefore , so ; (3 s.f.).
(v) Predict dosage and compare the source method
To estimate from a given by regression, fit on , not on . The line is . At , . The printed solution instead solves , giving . That is inversion of the forward fitted model, not the reverse least-squares regression; the two predictions differ because . Both extrapolate beyond the observed decrease range and are unreliable.
Compare your sketch
Expand diagramFit diagram to page
Use the scrollbars or arrow keys to inspect details.
Common mistakes
Algebraically reversing one least-squares line does not produce the other least-squares line. Retain the printed 5.38 result as a source method, alongside its qualification.
Solution notes
Source-method discrepancy in(v): source inverts the y-on-ln(x) fit. The student explanation distinguishes this from ln(x)-on-y regression, independently checked at 5.31686454. No source result is silently replaced. This is a mathematical data exercise.