Worked solution
Recover a missing score and compare model shapes
Eight randomly selected students were asked to indicate the number of hours they spent studying Mathematics per week during the June holiday. The corresponding Mathematics Mid-year examination scores marked out of 100 marks of the eight students were recorded. The eight pairs of data are given in the table below.
| Time spent ( hours) | 2.0 | 2.4 | 3.0 | 3.8 | 4.8 | 7.2 | 8.2 | 9.4 |
|---|---|---|---|---|---|---|---|---|
| Mathematics score () | 10 | 19 | 47 | 64 | 78 | 76 | 84 |
(i) Given that the regression line of on is , find the value of . marks
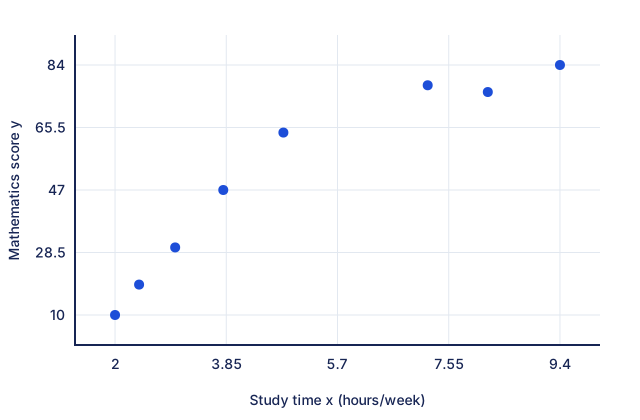
(ii) Draw a scatter diagram to illustrate the data. Calculate the product moment correlation coefficient between and . marks
(iii) Calculate the least squares estimates of and for the model . Find the product moment correlation coefficient between and . marks
(iv) Using your answers to parts (i) and (ii), explain which of or is the better model. marks
(v) Using the appropriate regression line, estimate the Mathematics Mid-year examination score of a student who spent 5.0 hours studying Mathematics during the June holiday. Comment on the reliability of your estimate. marks
[2013/VJC/II/8]
CJC · Review problems · Question 7
Answer
; raw ; log-model , , . Prefer the log model; predicted score .
(i) Use the sample means
. The regression line passes through , so . Also . Hence , giving the integer score . The tiny excess is due to the printed rounded coefficients.
(ii) Plot and calculate
Use and plot all eight pairs. The scores rise with study time but the pattern levels off. The raw coefficient is .
(iii) Transform study time
Regress on : . Thus , (3 s.f.). The transformed correlation is .
(iv) Select the better model
The logarithmic model is preferred: its correlation is closer to 1 than the raw , and its decreasing positive gradient matches the scatter pattern. The relevant transformed calculation is in part (iii), despite the printed reference to (i) and (ii).
(v) Estimate and qualify
Using the unrounded logarithmic line at , . Since 5 lies within the observed study-time range and the chosen model has , this is a reasonable interpolated estimate for the source exercise, not a guaranteed individual score.
Compare your sketch
Expand diagramFit diagram to page
Use the scrollbars or arrow keys to inspect details.
Common mistakes
Compare correlations for the models actually being compared. Use the selected log model’s coefficient when discussing its prediction.
Solution notes
Printed (iv) references(i)/(ii) rather than (ii)/(iii); source solution also calls the log fit part (ii) and uses rawr=.944 in the final reliability explanation. Correct references and chosen-modelr=.986 are explicitly explained; original native wording retained.