Worked solution
Draw a logarithmic pattern and regress mass on time
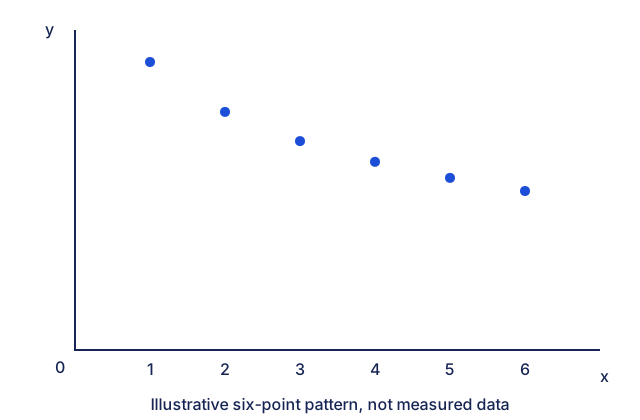
(a) Sketch a scatter diagram that might be expected for the case when and are related approximately by , where is positive and is negative. In this case, your diagram should include 6 points, approximately equally spaced with respect to , and with all - and -values positive. mark
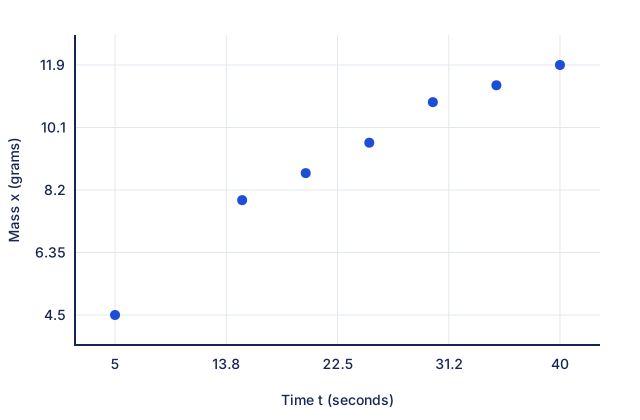
(b) The mass, grams, of a certain substance present in a chemical reaction varies with time, seconds. Observations at successive times give the data shown in the following table.
| Time, | 5 | 15 | 20 | 25 | 30 | 35 | 40 |
|---|---|---|---|---|---|---|---|
| Mass, | 4.5 | 7.9 | 8.7 | 9.6 | 10.8 | 11.3 | 11.9 |
(i) Draw a scatter diagram for these values, labelling the axes. mark
(ii) Calculate the product moment correlation coefficient between and and comment on its value in context of the data. marks
(iii) State, with a reason, the effect on the product moment correlation coefficient found in part (ii) if the mass was recorded in milligrams instead of grams. mark
(iv) State, with a reason, which least squares regression line should be used to express a possible linear relation between and . Hence find the equation of a suitable regression line for this model. marks
(v) Use the equation of your regression line to estimate the mass of the certain substance present at 10 seconds and comment on the reliability of your estimate. marks
[2017/MI/MYE/J2/10]
CJC · Review problems · Question 8
Answer
(a) Six positive, equally spaced-in-x points decreasing and flattening. (b) , unchanged by grams→milligrams; . At 10 s, retained-precision estimate g (source: g).
(a) A possible six-point sketch
For with , and . Draw six positive points with equally spaced horizontal coordinates, decreasing steeply at first and then flattening. One illustrative choice is and , all positive. These are authored example coordinates, not an extra printed table.
(b)(i) Plot the measured data
Plot all seven table pairs with time in seconds horizontally and mass in grams vertically. The comparison sketch below is for these measured data, distinct from the illustrative sketch in(a).
(b)(ii) Correlation in context
. There is a strong positive linear association between elapsed time and mass in this sample.
(b)(iii) Convert grams to milligrams
Multiplying every mass by the positive factor 1000 leaves unchanged. Its value does not depend on a positive change of measurement scale.
(b)(iv) Select the regression direction
Time is the controlled explanatory variable, and mass is the response to estimate. Regress on : , or (3 s.f.).
(b)(v) Predict using retained precision
At , the unrounded line gives g, which is g (3 s.f.). The printed answer is g; rounding coefficients first gives from the printed 5-s.f. line, or from the 3-s.f. line . Retaining full precision avoids this double-rounding difference. Both source result and rounding distinction are recorded. Since 10 lies within and is close to 1, this is a reasonable interpolated estimate under the linear model.
Compare your sketch
Expand diagramFit diagram to page
Use the scrollbars or arrow keys to inspect details.
Common mistakes
Keep full calculator coefficients until the final answer: the 3-s.f. equation changes the 3-s.f. prediction here.
Solution notes
Q8 source rounding discrepancy: exact least squares predicts 6.304918033, hence 6.30 g(3 sf). The printed 5 sf coefficients .20566 and 4.2484 give 6.305, at the 3 sf rounding threshold; its 3 sf line .206t+4.25 gives 6.31. This explains the source 6.31 through coefficient rounding. Student explanation retains both and identifies the precision effect.