Worked solution
Compare a linear trend with a transformed quadratic
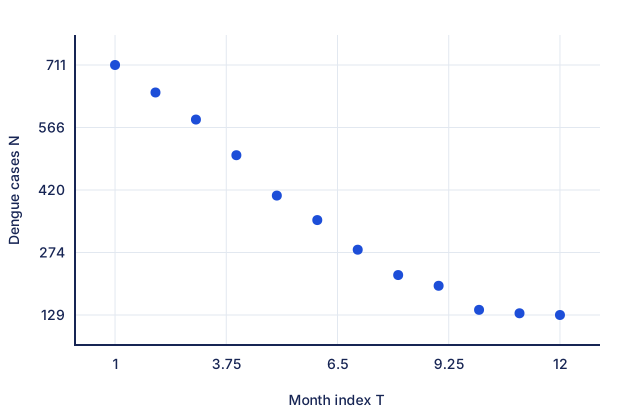
In a country, a government agency tracks the number of cases of dengue fever () each month (). The number of cases prior to May 2017 are shown in the table below.
| 1 | 2 | 3 | 4 | 5 | 6 | 7 | 8 | 9 | 10 | 11 | 12 | |
|---|---|---|---|---|---|---|---|---|---|---|---|---|
| 711 | 647 | 584 | 501 | 407 | 350 | 281 | 222 | 197 | 141 | 133 | 129 |
(i) Sketch a scatter diagram to illustrate the data. marks
(ii) Calculate the value of the product moment correlation coefficient and find the equation of the regression line of on , in the form , giving the values of and correct to 3 significant figures. marks
(iii) A statistician suggested that the model would be more appropriate. Find the values of and . State whether you agree, justifying your answer. marks
[2017/RVHS/MYE/J2/10]
CJC · Review problems · Question 9
Answer
; . For , , , transformed ; prefer the quadratic within the observed range.
(i) Plot the monthly counts
Plot all twelve table pairs with month index horizontally and number of cases vertically. The counts decrease, with the decline becoming less steep near the end; see the comparison sketch.
(ii) Linear regression
Regress on . The correlation is . The line is , or (3 s.f.).
(iii) Transform and compare
Let . For , the transformed values are 841, 784, 729, 676, 625, 576, 529, 484, 441, 400, 361, 324. Regress on to get . Hence , (3 s.f.). The transformed correlation is . Since and the scatter is curved, the quadratic model better represents this observed range, as in the source. This does not establish that it is suitable for long-term extrapolation: near the fitted model even becomes negative.
Compare your sketch
Expand diagramFit diagram to page
Use the scrollbars or arrow keys to inspect details.
Common mistakes
Compare absolute correlations when one transformation reverses the direction. A better sample fit does not certify future epidemiological behaviour.
Solution notes
The transformed working table and every twelve input pair are retained. The source agrees with the quadratic fit on the observed data; the student explanation qualifies its long-term behaviour without altering any printed ask or answer.