Worked solution
Interpret an upper-tail p-value in context
Based on past data, the mean number of dengue cases per day was reported as 30. The authorities suspect that the recent hot and wet weather has increased the mean number of dengue cases per day. A random sample of 60 days is taken and the number of dengue cases per day, , is summarised by
(i) Calculate unbiased estimates of the mean and variance of . marks
(ii) Test, at the 5% significance level, whether the mean number of dengue cases per day has increased. marks
Explain, in the context of the question, the meaning of the p-value. mark
[2011/DHS/II/10(part of)]
CJC · Review problems · Question 5
Answer
, ; , : reject at 5%.
(i) Reconstruct the centered estimates
. The unbiased variance is
(ii) P-value method
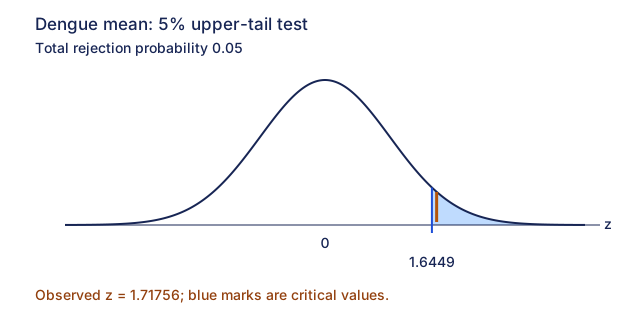
Let be the population mean daily case count. Test against . Under , using the large sample. Then The upper-tail p-value is , so reject : there is sufficient evidence at 5% that the mean daily count exceeds 30. Source calculator input: Z-Test Stats, null 30, estimated standard deviation 6.013168224, sample mean 94/3,n 60, greater-than alternative; its displayed p≈.0429387435 agrees.
(ii) Critical-value method
The 5% upper-tail critical value is . Since exceeds it, the same rejection decision follows.
Meaning of p
If the population mean really is 30 cases per day, the approximate probability that a random sample of 60 days has a mean at least as large as the observed is 0.04294. This probability is conditional on the null model; it is not the probability that the increased-mean claim is false.
Compare your sketch
Expand diagramFit diagram to page
Use the scrollbars or arrow keys to inspect details.
Common mistakes
Condition the p-value interpretation on a population mean of 30 and a sample size of 60.
Solution notes
Source prose rounds p to.0430 while its calculator shows.0429387435; independent value is.0429387790. Source critical value 1.6445 is a small transcription error for 1.644853627 (≈1.6449). Neither changes the decision.