Worked solution
Distinguish the target population and invert a non-rejection condition
In this question you should state clearly the variables and the values of the parameters of any distribution you use.
A pharmaceutical company has 300 employees from the research department and 330 employees from the manufacturing department.
(i) Billy wishes to find out about the stress level of employees in the research department, so he sends a survey to the 300 employees in the research department. Explain whether these 300 employees form a sample or a population. mark
(ii) Charlie wishes to conduct a survey regarding the employees’ experiences with a new facility.100 of them are randomly selected from the research department and the other 100 are randomly selected from the manufacturing department. Explain whether the method will form a random sample. marks
The pharmaceutical company produces pills against a particular bacteria. The manager claims that the average time taken to manufacture a batch of pills is less than 12 hours. The time taken in hours, , was measured on 80 occasions and the results are summarised as follows:
(iii) Find the unbiased estimates of the population mean and variance of the time taken to manufacture a batch of pills. marks
(iv) Carry out a hypothesis test on the manager’s claim. Find the p-value for this test and explain what it indicates about the manager’s claim. marks
It was found that the testing process had not been rigorous enough and the same hypothesis test was conducted in another random sample of 80 observations. The sample mean was found to be hours and the sample standard deviation was found to be 1.5 hours. It was found that the manager’s claim was not supported at 1% level of significance.
(v) Find the range of values of , correct to 3 decimal places. marks
[2021/DHS/II/11]
CJC · Review problems · Question 10
Answer
(i) Target population. (ii) Disproportionate stratified random sample, not a simple random sample. (iii) , . (iv) , strong evidence for the claim. (v) ; on a 3 d.p.grid, .
(i) Target population
All 300 research-department employees form the population for Billy’s stated question about that department; surveying all of them is a census of his target population, not a sample of it.
(ii) Compare selection probabilities
A research employee has inclusion probability 100/300=1/3, whereas a manufacturing employee has 100/330=10/33. They differ, so this is not a simple random sample of all 630 employees. Since selection within each department is random, it is a stratified random sample with disproportionate allocation; the source’s “not a random sample” is interpreted in its simple-random-sample sense.
(iii) Estimate batch-time moments
hours. The unbiased variance is
(iv) State the test and interpret p
Let be batch manufacture time in hours and . Test against . Under , use the large-sample approximation . Then and left-tail . This is very strong evidence against the 12-hour null in favour of a mean below 12 hours. No significance level is specified in(iv); the p-value would reject at conventional 1% or 5% levels. Evidence for the claim is not a proof that it is “valid” in every circumstance.
(v) Critical-value method
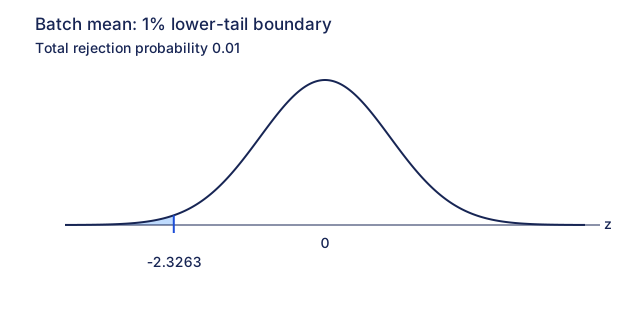
The new sample has n 80 and, using the source’s divisor-n sample SD convention, unbiased variance . Under , . With the convention reject if , non-rejection requires Hence . Report the boundary as 11.607 to 3 d.p., but retain the strict inequality against its unrounded value. If possible mean values are themselves restricted to a 3 d.p.grid, the smallest non-rejecting value is 11.608, so on that grid .
(v) P-value method and source comparison
The same condition is ; normal CDF inversion gives the identical unrounded boundary. The source shows 11.60739, then writes “k>11.608 or k≥11.608”. Those two inequalities are not equivalent for real-valued k. The latter is appropriate on a 3 d.p.grid; the exact continuous condition is . The source mean-axis critical diagram is reconstructed in standardized z coordinates, with this mean boundary explained here.
Compare your sketch
Expand diagramFit diagram to page
Use the scrollbars or arrow keys to inspect details.
Common mistakes
Do not confuse a rounded boundary with rounding the possible values of k. Do not call a stratified random design entirely non-random.
Solution notes
Source identical > and ≥ wording at 11.608 is ambiguous after rounding. Exact continuous and 3 d.p.grid interpretations are both retained. Its tiny p-value supports, rather than proves, the manager’s claim. Source variable and distribution parameters are explicit in every test here.