Worked solution
Solve a normal interval condition and assess the model
In the problem’s model, birth weights for babies of non-smoking mothers at a hospital are normal with mean 3.05 kg and variance . The hospital’s stated classifications are:
| Birth weight | Classification in the problem |
|---|---|
| Below 1.5 kg | Very low |
| 1.5 kg to 2.5 kg | Low |
| 2.5 kg to 4.0 kg | Normal |
| Above 4.0 kg | High |
(i) A sample suggests 20.2% are in the low category. Assuming this holds for the population, find two possible values to 2 dp and explain why one should be rejected. marks
Babies of smoking mothers have mean 2.80 kg. For the remaining parts, explicitly assume both populations are normal with standard deviation 0.86 kg.
(ii) Three smoking mothers are chosen at random. Find the probability all their babies are outside the normal-weight category, stating a required assumption. marks
(iii) Find the probability that the average weight of two babies of non-smoking mothers differs from twice the weight of one baby of a smoking mother by less than 2 kg. marks
Babies outside the normal category remain in hospital for observation until stable. Depending on treatment and length of stay, hospitalisation cost per baby has mean $2800 and standard deviation $ 500.
(iv) For 50 such babies, find the probability that average cost exceeds $3000. marks
[2019/NJC/II/6]
CJC · Review problems · Question 10
Answer
(i) or 1.56 kg; source prefers 0.70 on modelling grounds. (ii) with independence; (iii) ; (iv) .
(i) Retain both mathematical solutions
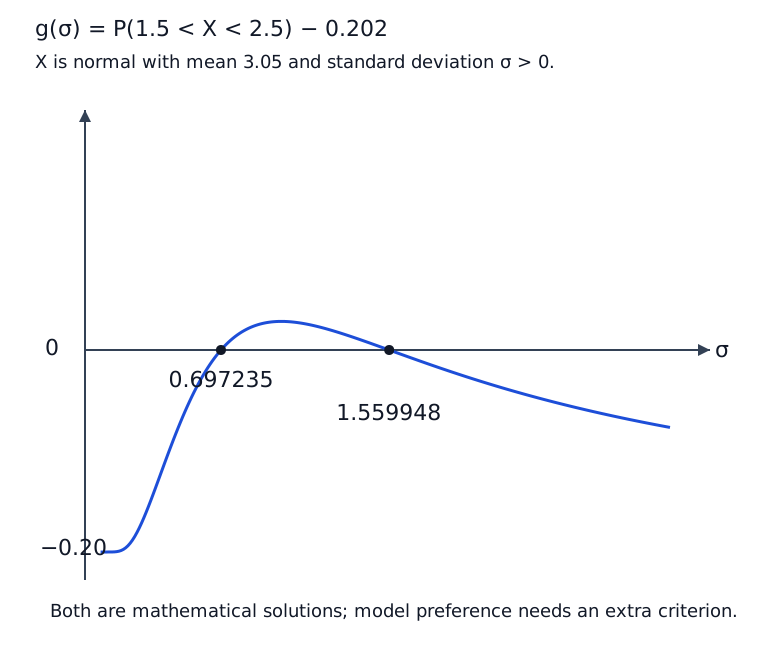
For , solve for . The source plots this probability minus 0.202 against . The roots are approximately 0.697235 and 1.559948, hence kg or 1.56 kg to 2 dp.
(i) Explain the source’s modelling preference
Using the printed rounded values, the source finds about 70% in the normal-weight category for versus 37% for . It rejects 1.56 because this would make the outside categories collectively more likely. Its alternative reason is a negative-weight probability of about 0.03 for 1.56 versus about for 0.70. Both roots solve the stated interval equation; preferring the smaller one uses an additional modelling-plausibility criterion. Neither positive-variance normal model literally excludes all negative weights.
(ii) Use the new stated standard deviation and independence
Now use the explicitly imposed , not the value chosen in(i). For , the outside-category probability is . Assuming independent birth weights, the requested probability is .
(iii) Compare a mean with twice one observation
Let independent and . For , the mean is and variance is . Thus and .
(iv) Approximate the mean cost
For independent identically distributed costs with mean 2800 and variance , the CLT gives . Hence .
Compare your sketch
Expand diagramFit diagram to page
Use the scrollbars or arrow keys to inspect details.
Common mistakes
The word “normal” is both a distribution family and a category label here; the category need not be a mathematical majority. State the extra modelling judgement used to reject a root.
Solution notes
Both roots round as printed: the lower root is 0.697235…, so 0.70 is correct to 2dp. The tiny calculator display was independently checked numerically to avoid a false rounding correction. The model-based rejection is qualified rather than presented as a unique consequence of the interval probability.