Worked solution
Compare absolute-value graphs in two ways
Find the solution sets of the following inequalities.
(a) ,
(b) .
CJC · Review Problems · Question 10
Answer
(a) ; (b) .
(a) Method 1: one graph
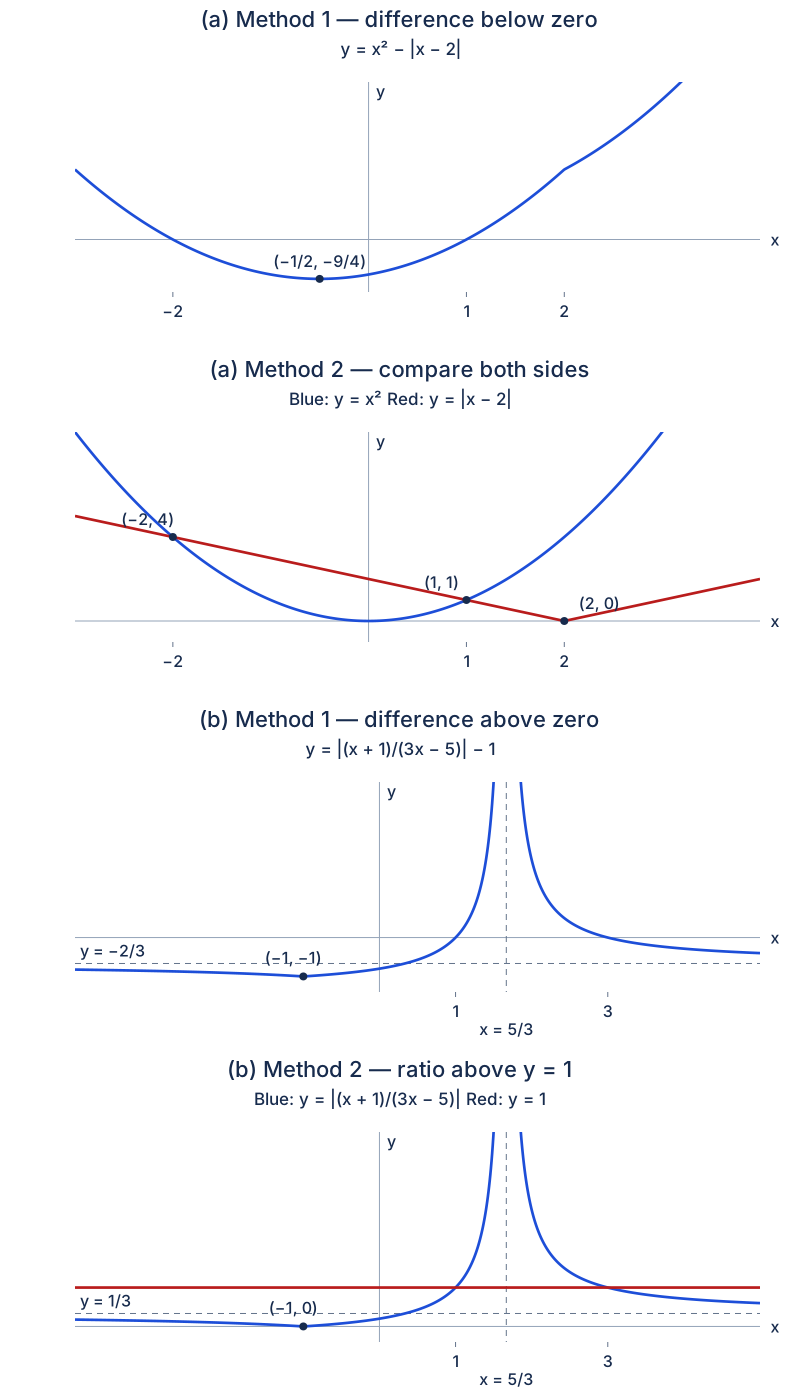
Sketch . The graph crosses the axis at and has the source-labelled minimum . It lies below the axis exactly for .
(a) Method 2: two graphs
Sketch and on the same axes. They intersect at and ; the absolute-value graph has vertex . The parabola lies below the absolute-value graph between the intersections, so the set is .
(b) Method 1: one graph
Sketch . Its domain excludes , its vertical asymptote is , and its horizontal asymptote is . It has minimum and zeros . It is positive between 1 and 3, with the pole removed: .
(b) Method 2: two graphs
Compare with . The ratio has minimum , horizontal asymptote and vertical asymptote . The intersections with occur at ; the ratio is larger on .
Compare your sketch
Expand diagramFit diagram to page
Use the scrollbars or arrow keys to inspect details.
Common mistakes
An interval bounded by two intersections can still contain a forbidden denominator input.
Solution notes
The diagrams are independently reconstructed mathematical equivalents. The plotted geometry is illustrative; use the labelled exact or approximate values and the stated domain.
The first printed graph for (b) appears to label its left zero as 2; the printed final set and second graph give 1. Solving |x+1|=|3x−5| gives 1 and 3, so the reconstruction labels 1. No marks are printed for Q10.