Worked solution
A parameter hyperbola and a logarithmic input
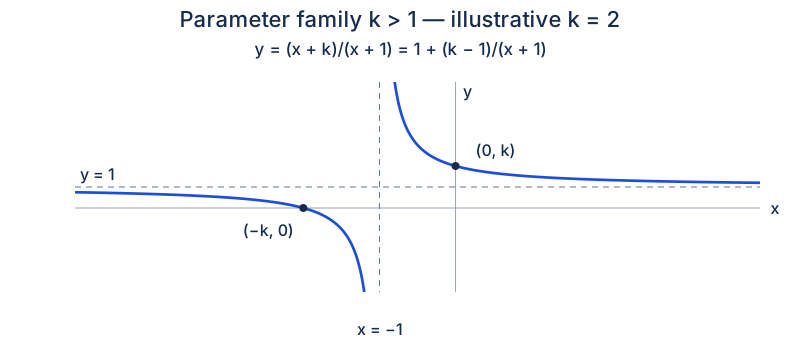
(i) Sketch the curve with equation , where .
State the equations of any asymptotes and the coordinates of the points where the curve crosses the axes. marks
(ii) Hence solve the inequality . marks
[2016/VJC/Promo/10(a)(modified)]
CJC · Review Problems · Question 14
Answer
Asymptotes , ; intercepts , . (ii) .
(i)
Write . Since , the vertical asymptote is and the horizontal asymptote is . The intercepts are and . The left branch lies below , and the right branch lies above it; both decrease. Since , the graph is nonnegative for or .
(ii)
Replace the graph input by , with and . Then or . Since exponentiation preserves order, the answer is or .
Compare your sketch
Expand diagramFit diagram to page
Use the scrollbars or arrow keys to inspect details.
Common mistakes
The numerator zero is included; the denominator zero and nonpositive logarithm inputs are excluded.
Solution notes
The diagrams are independently reconstructed mathematical equivalents. The plotted geometry is illustrative; use the labelled exact or approximate values and the stated domain.
The source labels the deduction as (i) again in its solution; it answers printed part (ii). The reconstruction preserves the question labels. The illustrative graph uses k=2 without restricting the general result.