Worked solution
Distinguish an income association from a causal claim
The monthly incomes of eight former classmates of 2T03 in CJC are tabulated against their Advanced Level Examination aggregates.
| Aggregate | Monthly income (dollars) |
|---|---|
| 72 | 4400 |
| 55 | 3550 |
| 65 | 4000 |
| 45 | 3000 |
| 60 | 3800 |
| 50 | 3200 |
| 42 | 2850 |
| 62 | 3950 |
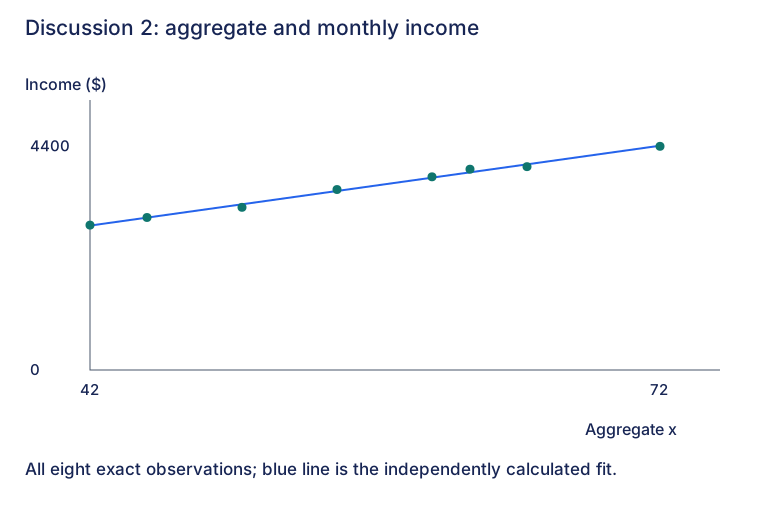
(i) Obtain a scatter diagram and calculate the linear correlation coefficient.
(ii) Comment on the claim: “The strong correlation between a person’s aggregate in his Advanced Level Examination and his subsequent monthly income shows that good results determine one’s income.”
(iii) Find the regression line of on .
CJC · Discussion · Question 2
(i) Plot all pairs and calculate r
Answer
(3 s.f.).
Plot aggregate horizontally and monthly income vertically, preserving each classmate’s pair. The independently reconstructed scatter rises almost linearly. From , , , and , the coefficient is , agreeing with the printed . The blue line is the fit calculated for part (iii), not additional source data.
(ii) Evaluate the quoted conclusion
Answer
The strong sample correlation does not establish that examination results determine income.
The association among these eight former classmates does not isolate a causal effect of examination performance. Other factors such as later education, experience or occupation may affect income. These are possible explanations, not measured variables in the supplied table. The source asks for a comment but prints no explanation; this response is authored.
(iii) Fit income on aggregate
Answer
(3 s.f.).
The least-squares gradient and intercept are
Thus , reported as the printed . Use aggregate as explanatory and income as response for this requested direction. The intercept is part of the fitted model; it is not evidence about someone outside the observed aggregate range 42–72.
Compare your sketch
Expand diagramFit diagram to page
Use the scrollbars or arrow keys to inspect details.
Solution notes
All eight pairs and three asks retained. Key prints correlation and regression equation only; scatter, derivations and causal explanation are authored. No printed marks.