Worked solution
Fit crane profits and assess a sales target
An engineering company makes cranes. The numbers sold in each three-month period for two years and the profits (thousand dollars) on those sales are:
| 15 | 290 |
| 17 | 350 |
| 13 | 270 |
| 21 | 430 |
| 16 | 340 |
| 22 | 410 |
| 14 | 300 |
| 18 | 360 |
(i) Sketch the scatter diagram as shown on your calculator.
(ii) Find and and mark their point on the scatter diagram.
(iii) Calculate the regression of on and draw it on the scatter diagram.
(iv) Calculate the product moment correlation coefficient and comment on it in relation to the scatter.
(v) Estimate the profit corresponding to a target of 20 cranes for the next three-month period.
(vi) Comment on the validity of using the regression from (iii) to predict profit if 40 cranes were sold in a three-month period.
[2008/H1/I/11]
CJC · Discussion · Question 3
(i) Keep the profit units and paired order
Answer
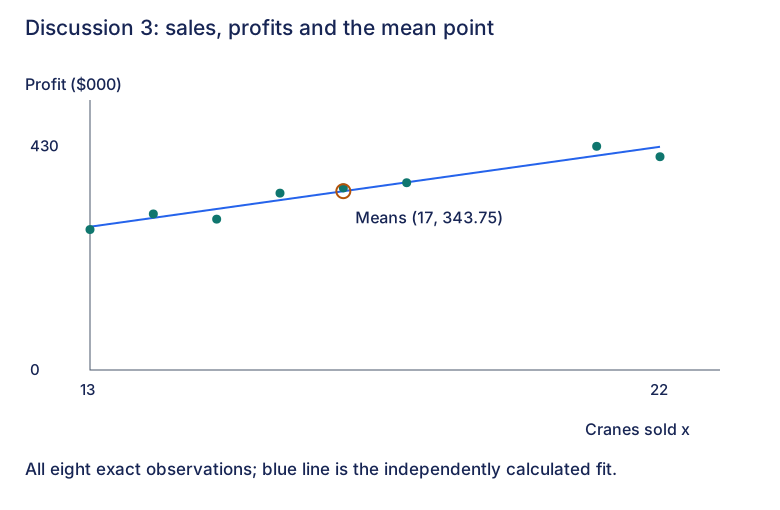
The eight observations show a strong rising, approximately linear pattern.
Plot cranes sold horizontally and profit in thousand dollars vertically. Preserve all eight three-month observations. The reconstructed diagram includes the mean point and fitted line requested in the following parts; its input axis is cropped to 13–22 and its profit axis starts at zero.
(ii) Mark the mean point
Answer
.
The sums are and across eight periods. Thus and . Both printed values are retained. The mean point is circled on the scatter and lies on the fitted line.
(iii) Calculate and draw the regression
Answer
(3 s.f.).
The independently calculated centred sums are and , giving
Hence , reported as the printed . The diagram uses the full-precision line rather than rounded coefficients.
(iv) Relate r to the plotted pattern
Answer
(3 s.f.), consistent with a strong positive linear pattern.
Using , calculate , matching the printed . The scatter shows points relatively close to a rising line; neither perfect correlation nor causation is claimed.
(v) Predict profit at the target
Answer
Predicted profit: $395,000.
Use the full coefficients at :
Since is measured in thousands of dollars, the predicted profit is $395,000, agreeing with the printed answer. Using the rounded equation would give 395.3 thousand instead; retain precision until the final conversion. The target 20 lies inside the observed 13–22 sales range, though future conditions still need to remain comparable.
(vi) Check the proposed sales input
Answer
The prediction at 40 cranes is unreliable extrapolation.
The observed quarterly sales range is 13–22 cranes, so 40 is well outside it. The fitted sales–profit relationship may change at that scale, for example if production costs or capacity change. These are possible reasons for caution, not extra data in the source. Strong correlation within the observed sample does not establish validity at 40.
Compare your sketch
Expand diagramFit diagram to page
Use the scrollbars or arrow keys to inspect details.
Solution notes
All eight pairs, six asks and attribution retained. Printed key gives means, regression, correlation and $395000; complete working, scatter/line/mean marker and validity explanations authored and independently checked. No printed marks.