Worked solution
Sketch possible correlations and model monthly earnings
(a) Eight pairs of measured values are given. Sketch a possible scatter diagram for each case: (i) correlation approximately zero; (ii) correlation approximately .
(b) Monthly earnings thousand dollars of seven workers of ages years are:
| 18 | 2.55 |
| 20 | 2.65 |
| 22 | 2.85 |
| 27 | 3.15 |
| 35 | 4.76 |
| 45 | 5.45 |
| 55 | 6.26 |
(i) Sketch the scatter diagram as shown on your calculator.
(ii) Find the product moment correlation coefficient.
(iii) Find the regression of on as , with correct to 4 decimal places.
(iv) Estimate monthly earnings of a 40-year-old worker. State why you would expect the estimate to be reliable.
(v) Every worker receives an increase of thousand dollars per month. Without further calculations state the expected changes in and .
[2010/H1/I/11]
CJC · Discussion · Question 4
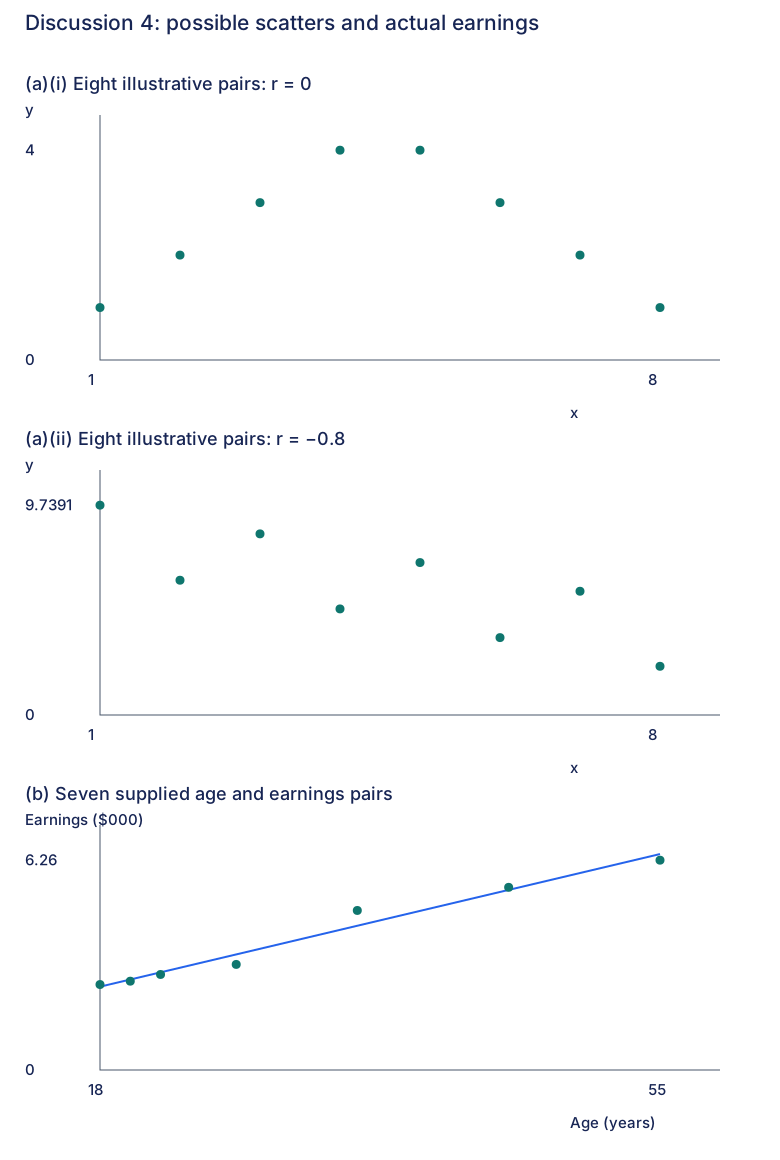
(a)(i) Give eight possible pairs with zero linear correlation
Answer
An eight-point symmetric curved scatter can have .
One authored construction uses and . The symmetric cross-products cancel, giving zero linear correlation. The arch still has a nonlinear pattern, so this does not assert no relationship or statistical independence. Other possible eight-point sketches are valid; these are not the source’s unprovided measured values.
(a)(ii) Give eight possible pairs with negative correlation
Answer
Use eight points scattered about a falling line, with .
The second panel is an independently constructed eight-point example whose coefficient was checked to be exactly −0.8. It has visible spread about a falling trend, rather than a perfect straight line. These illustrative coordinates are not claimed to be printed data; the source supplies only the target coefficient and point count.
(b)(i) Plot the seven measured observations
Answer
The seven supplied pairs show a strong positive, approximately linear trend.
Keep age on the horizontal axis and monthly earnings in thousand dollars vertically. The third panel retains every pair and adds the full-precision regression line requested in (iii). The two illustrative eight-point panels in (a) are separate datasets and must not be substituted for these seven observations.
(b)(ii) Calculate correlation
Answer
(3 s.f.).
Using all seven age/earnings pairs gives the independently checked coefficient , matching the printed . It summarises the strong positive linear pattern, not a universal age–income law.
(b)(iii) Round both coefficients to four decimal places
Answer
.
The full fit is . Rounding the gradient and intercept to the requested 4 decimal places gives the printed equation. Keep full coefficients for the later prediction; the response remains in thousands of dollars.
(b)(iv) Predict within the age range
Answer
Estimated monthly earnings: 4,840 dollars (3 s.f.).
At age 40, the full fit gives thousand dollars, or 4838.8829 dollars. This rounds to the printed 4,840 dollars. Age 40 is within 18–55 and the scatter is approximately linear with high positive correlation. These support the model for a comparable worker, but do not guarantee an individual salary; the source asks for expected reliability, not certainty.
(b)(v) Translate every response by the same amount
Answer
is unchanged; the new intercept is .
Adding thousand dollars to every earnings value translates the entire scatter vertically. Relative vertical deviations and the fitted gradient are unchanged; each fitted response rises by , so only the intercept changes. No new regression calculation is needed. Keep in the same thousand-dollar units as .
Compare your sketch
Expand diagramFit diagram to page
Use the scrollbars or arrow keys to inspect details.