Worked solution
Predict a record time without rounding away the result
The table gives world-record one-mile times, measured in seconds above 3 minutes 30 seconds, as at 1 January in various years.
| Year | Excess time (seconds) |
|---|---|
| 1930 | 40.4 |
| 1940 | 36.4 |
| 1950 | 31.3 |
| 1960 | 24.5 |
| 1970 | 21.1 |
| 1980 | 19.0 |
| 1990 | 16.3 |
| 2000 | 13.1 |
(i) Draw a scatter diagram.
(ii) Refer to both the scatter and context to comment on whether a linear model is appropriate.
(iii) Explain why a quadratic model would probably be inappropriate for long-term predictions.
(iv) Fit and predict the world-record time as at 1 January 2010. Comment on reliability.
[2009/II/6]
CJC · Discussion · Question 5
(i) Retain the offset-time definition
Answer
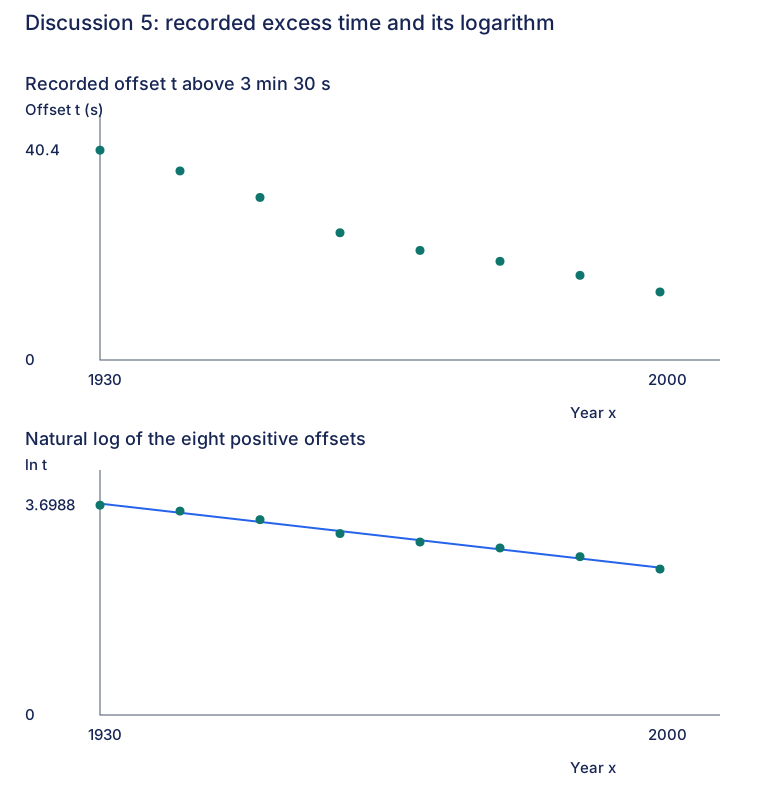
The eight plotted excess times fall over the observed years.
Plot year horizontally and vertically. The source defines as seconds above 210 seconds, not the total race time. The curve decreases and appears to flatten somewhat; all eight exact observations are retained. The second panel supplies the transformed plot used in (iv).
(ii) Separate local approximation from long-term behaviour
Answer
A line may give a rough local trend, but it does not capture the changing rate or justify long-term predictions.
The scatter is decreasing with some flattening, while a straight line enforces a constant rate of improvement. In this context a record series need not continue improving at a constant rate indefinitely. Extrapolating a decreasing line far enough eventually predicts an impossible nonpositive total race time. Merely predicting a negative offset is not itself proof of impossibility: 3 min 30 s is a chosen baseline, not a demonstrated physical limit.
(iii) Check a quadratic’s eventual behaviour
Answer
A quadratic can eventually predict worsening records or impossible total times.
A nonconstant quadratic has unbounded eventual behaviour. An upward quadratic eventually turns upwards and predicts rising record times, contrary to using a retained best-time record in the same event; a downward quadratic eventually gives nonpositive total times. The finite historical data do not justify either long-term trend. This is an authored explanation of the source’s contextual ask, not an empirical prediction about later real records.
(iv) Fit logarithms and restore total seconds
Answer
Predicted time: 3 min 41.4 s.
The full independently calculated fit is , with retained coefficients
It agrees with the printed rounded form . For the prediction use the retained coefficients, not the rounded form: the large year causes substantial cancellation between intercept and product.
Add the baseline 210 seconds: total 221.4259788212 seconds, or 3 min 41.4 s, matching the printed answer. Using the rounded equation gives a different result and is not justified for this calculation. The year 2010 is outside 1930–2000, so this is extrapolation; even a close transformed fit does not guarantee the record’s future development. The model’s asymptote at 210 seconds is an assumption of this offset-exponential form, not a proven physical minimum.
Compare your sketch
Expand diagramFit diagram to page
Use the scrollbars or arrow keys to inspect details.