Worked solution
Solve logistic growth and sketch its changing curvature
A fish population satisfies , with in weeks.
(i) Find the range of for strictly increasing population. Initially .
(ii) Show that .
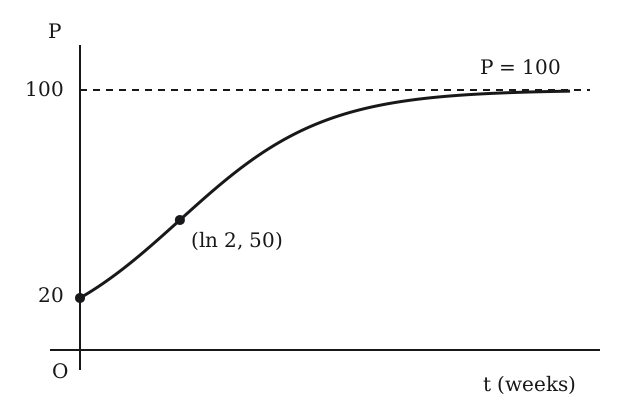
(iii) Describe the long-run population and sketch against .
[2013/CJC/II/4 (modified)]
CJC · Discussion · Question 10
Answer
(i) . (ii) . (iii) from below, with inflection .
(i) Determine the increasing range
precisely when . The equilibrium values and are not strictly increasing.
(ii) Integrate using partial fractions
. Since , integration gives . Equivalently , so . At , , proving the requested formula.
(iii) Sketch the initial value, inflection and long-run limit
The population starts at and increases towards from below as . For the curvature, : it is positive while , zero at , and negative afterwards. Thus the graph is initially convex, has an inflection at and then becomes concave down towards the asymptote .
Compare your sketch
Expand diagramFit diagram to page
Use the scrollbars or arrow keys to inspect details.
Common mistakes
Starting below half the limiting population means the curve initially bends upwards.