Worked solution
Test the claimed bulb power and change the sample size
A manufacturer makes light bulbs with power normally distributed with mean 13 watts and standard deviation 2.716 watts. A sample of 50 bulbs has mean power 13.168 watts.
(i) Test at the 5% significance level whether the manufacturer is understating the mean power.
(ii) Explain “a 5% level of significance” in this context.
(iii) At the 10% significance level, what is the least sample size for concluding that the manufacturer has understated the mean power?
[2007/CJC/H1/9]
CJC · Discussion · Question 1
Answer
(i) Do not reject at 5% (). (ii) A 5% conditional Type I error rate. (iii) Minimum for the same observed mean.
(i) Null model and p-value method
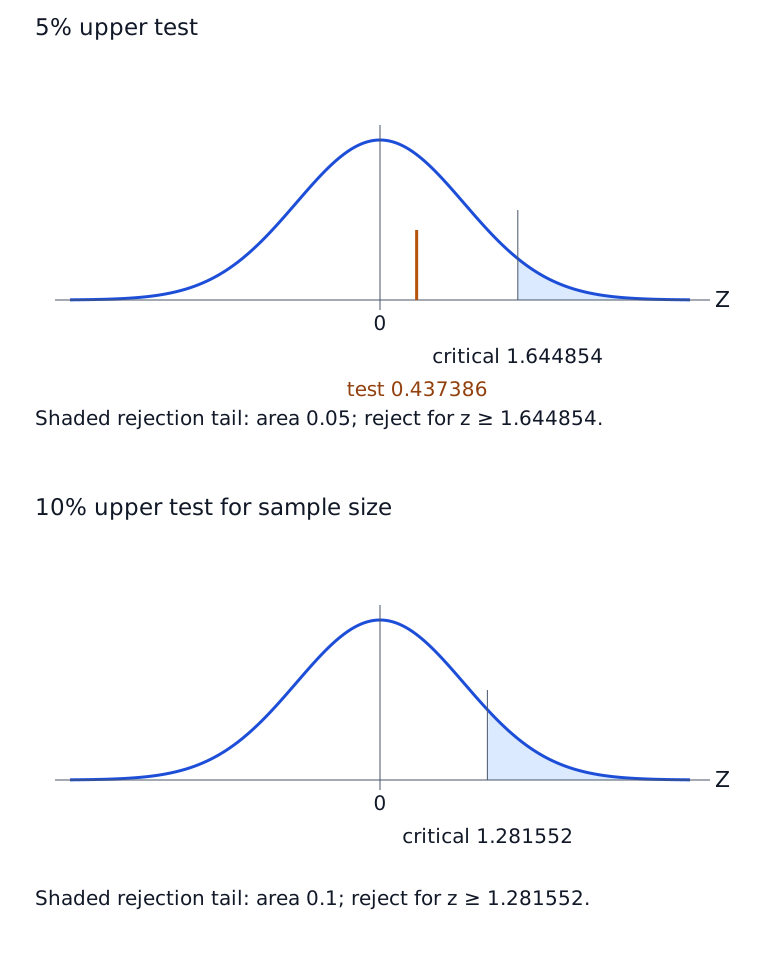
Let be population mean power in watts. Treat 13 as the claimed null value to be tested: , . Under and independent normal sampling, exactly. Then . The upper-tail p-value is . Do not reject: there is insufficient evidence at 5% that the manufacturer understates the mean.
(i) Critical-value and calculator methods
The 5% upper critical value is . Reject for ; the observed 0.43739 lies outside the rejection tail. The source calculator uses Z-Test → Stats, , , , , alternative >, then Calculate. Its output , has the same printed conclusion.
(ii) Conditional false-positive probability
If the true population mean is 13 watts, applying this rule to repeated independent samples would wrongly conclude that the manufacturer understates the mean in 5% of cases. This is a conditional Type I error rate, not a 5% posterior probability that this conclusion or the null hypothesis is false.
(iii) Keep the hypothetical observed difference fixed
At 10%, use . For the same mean 13.168 and known SD 2.716, rejection needs , so and the least integer is 430. The source rounds the critical value to 1.2816 and the bound to 429.3, with the same integer. A new larger sample is not guaranteed to reproduce the old mean; this is a threshold calculation conditional on that mean, not a power calculation.
Compare your sketch
Expand diagramFit diagram to page
Use the scrollbars or arrow keys to inspect details.
Common mistakes
The stated mean 13 is the reference claim being tested. A significance level is not power, and increasing n does not guarantee rejection in a future random sample.