Worked solution
Test a longer-life bulb claim using CLT
For many years the Consumer Union has found that the mean lifetime of a 100-watt light bulb is 72 days of continuous use, with standard deviation 12 days. The company markets a “new and improved” bulb yielding longer life. A sample of 55 new bulbs has average lifetime 75.2 days. Does this provide sufficient evidence of superiority at the 5% significance level?
CJC · Discussion · Question 2
Answer
Reject at 5%; upper-tail supports a mean lifetime above 72 days.
State the model and test direction
Let be the new bulbs’ population mean lifetime. Test against . As in the source, assume the new population still has SD 12 days and the 55 observations are independent and representative. Normality of individual lifetimes is not given; use under by CLT.
Both numerical decision methods
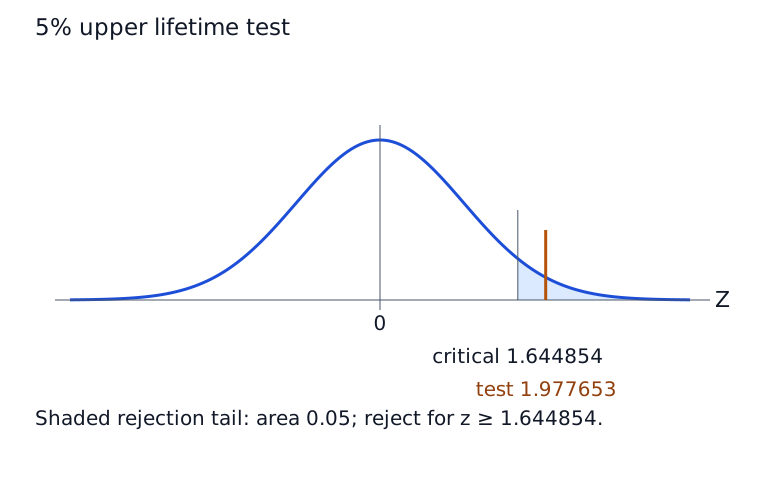
. The upper-tail p-value is , so reject. Equivalently, , the 5% upper critical value. The source Z-Test → Stats entries are , , , , alternative >. There is sufficient evidence at 5% of a mean lifetime above 72 days. “Superior” here refers only to longer mean life, not every aspect of quality.
Compare your sketch
Expand diagramFit diagram to page
Use the scrollbars or arrow keys to inspect details.
Common mistakes
The historical SD need not automatically carry over to a changed product. This is an assumption of the source test, and n 55 does not guarantee an accurate normal tail for every possible population.