Worked solution
Test standby time and compare significance statements
A random sample of 90 mobile-phone batteries has standby times hours summarized by and . Test at 1% whether the population mean standby time is less than 36.0 hours.
The same type is advertised as having talk-time 5 hours. A separate test at 5% finds significant evidence that population mean talk-time is less than 5 hours. Using only that information, classify each statement as necessarily true, necessarily false, or neither, giving reasons:
(a) There is significant evidence at 10% that the population mean talk-time is less than 5 hours.
(b) There is significant evidence at 5% that the population mean talk-time is not 5 hours.
[N2001/II/10]
CJC · Discussion · Question 4
Answer
Standby-time: do not reject at 1%, . Talk-time: (a) necessarily true; (b) neither necessarily true nor necessarily false.
Standby-time estimates and null model
and Test against . For independent large-sample observations the source uses by CLT with estimated variance, so its standardised statistic is approximately standard normal.
Standby-time p-value, critical value and screen
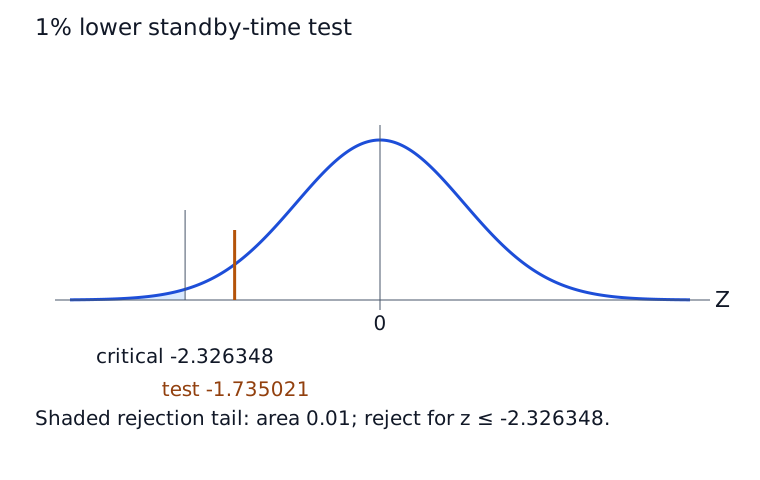
. The lower-tail : do not reject. Equivalently, , the 1% lower critical value. There is insufficient evidence at 1% that mean standby time is below 36 h. The source screen enters , from rounded variance 146.46, , , alternative <, producing , . Its hand calculation instead uses mean 33.78; these small premature-rounding differences leave the requested conclusion unchanged.
(a) Necessarily true for the same one-sided test
For talk-time, , has by the given result. Therefore , so the same data/model/alternative also reject at 10%.
(b) Neither necessarily true nor necessarily false
For the source’s symmetric continuous normal reference, the observed lower-tail statistic is negative and the two-sided p-value is . The given only gives , not . For example, one-sided gives two-sided 0.04 and rejects at 5%; one-sided 0.04 gives two-sided 0.08 and does not. Changing the alternative changes the p-value; the standby-time test does not supply this talk-time p-value.
Compare your sketch
Expand diagramFit diagram to page
Use the scrollbars or arrow keys to inspect details.
Common mistakes
Use the same data, statistic and alternative when comparing significance levels. A 5% one-sided rejection need not be a 5% two-sided rejection.