Algebra readiness
Work with indices and exponential equations · Diagrams
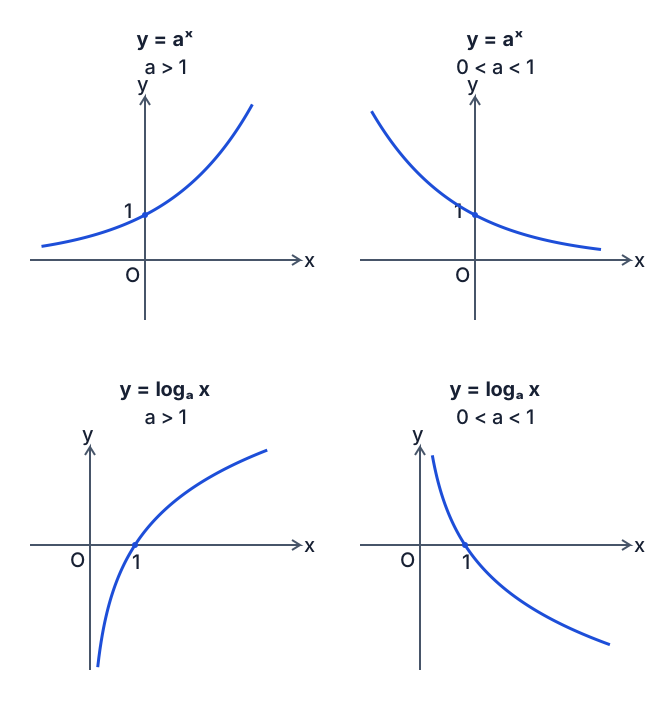
Exponential and logarithm graphs for both base ranges
Compare exponentials and logarithms
Domain: all real inputs. Range: y > 0. The curve increases; y = 0 is a horizontal asymptote, never an attained value.
Loading graph…
Choose an exponential or logarithm method
- Check the base and domain.
- Rewrite using a common base or logarithms.
- Check answers in the original equation.