Review practice · Section 2 of 2
Questions 7–10 in this collection
Derive the insect model and restore its zero equilibrium · Explain the product of infected and susceptible proportions · +2 more
- 7
An insect population after weeks satisfies , . Show, rather than merely verify, the general solution . marks
Initially there are insects and the population tends to after a very long time. Find the time to reach three times the initial population, to the nearest day. marks
[2013/RI(JC)/I/7]
CJC · Review problems · Question 7
- 8
Find the general solution of , , , in the form . marks
Find the particular solution with , and sketch it. marks
Here models the proportion infected by a disease. Explain why the differential equation may be suitable. marks
[2013/RVHS/II/1]
CJC · Review problems · Question 8
- 9
A tank initially contains . Water enters at and leaves at a rate proportional to the volume . When , the net rate is . Set up and solve a differential equation to show . marks
(i) Describe what happens to the volume eventually. mark
(ii) Sketch against . marks
[2013/MJC/I/7]
CJC · Review problems · Question 9
- 10
The given diagram has quantity tonnes on the horizontal axis and price dollars per kg on the vertical axis. Consumer curve and producer line meet at . Consumer quantity is inversely proportional to price, while producer quantity is directly proportional to price.
(i) Interpret in context.
(ii) Find both equations, expressing in terms of .
A shortage occurs when consumer quantity exceeds producer quantity. The rate of increase of price after months is proportional to this shortage.
(iii) Given an initial price of $3 and a price of $3.65 after one month, find and sketch it, showing its long-term behaviour. Suggest why producers might use , , instead of .
Expand diagramFit diagram to page
Use the scrollbars or arrow keys to inspect details.
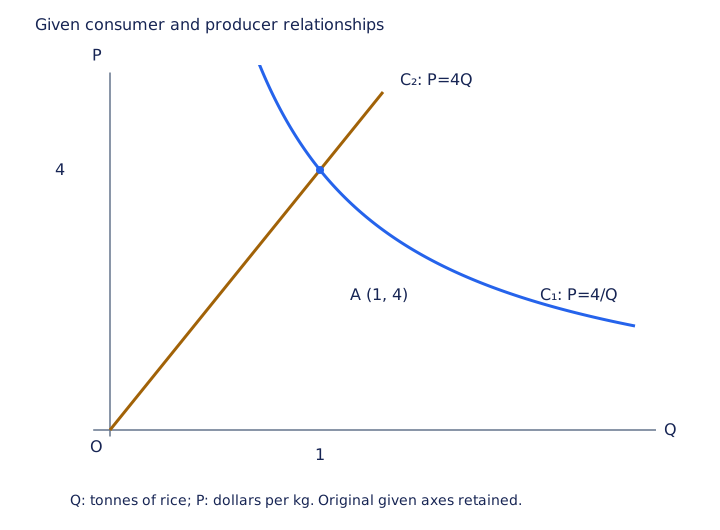
Given price-quantity diagram: Q tonnes is horizontal and P dollars per kg is vertical. Consumer hyperbola P=4/Q and producer line P=4Q meet at A=(1,4); the producer line passes through the origin. [2017/NJC/I/10(b)]
CJC · Review problems · Question 10