Discrete random variables
← Back to lesson · Complete chapter reading and print view · Open reference notes separately
By the end, you can
- Build a probability distribution from outcomes
- Calculate expectation and variance
- Transform means and variances correctly
about 35 minutes for the lesson · practise at your own pace.
The central idea
A random variable assigns a numerical value to each outcome. A discrete distribution has nonnegative probabilities summing to 1. Its expectation is and variance is . A linear transformation gives E(aX+b)=aE(X)+b and Var(aX+b)=a²Var(X).
From outcomes to a numerical random variable
The source outline covers discrete random variables, probability distributions, expectations and variances. A random variable is a function assigning one real number to each outcome in a sample space. Capital letters such as denote random variables; lowercase denotes an observed value. In the source example, and represent two independent repetitions of the three-toss experiment. Subscripts are labels; they do not by themselves imply independence.
For three coin tosses the complete sample space is , where H means heads and T means tails. Let count heads, assigning the values respectively. The Teacher note asks us to explain fair: heads and tails each have probability on an individual toss. With independent tosses, all eight sequences have probability ; independence is a separate modelling assumption.
A discrete random variable takes finitely many or at most countably infinitely many values. Draw two balls successively without replacement from four red and three black balls, and let X count reds:
| Colour outcome | RR | RB | BR | BB |
|---|---|---|---|---|
| Red count x | 2 | 1 | 1 | 0 |
R means a red ball was drawn and B means a black ball. Different outcomes can have the same numerical value; these four colour strings need not be equally likely.
Throw a fair die until the first six. Here T means a six and F means a non-six (different notation from the coin example):
| Stopped outcome | T | FT | FFT | FFFT | … |
|---|---|---|---|---|---|
| Number of throws y | 1 | 2 | 3 | 4 | … |
Under independent throws the die eventually gives a six with probability one. The source lists the finite stopped outcomes; the never-six sequence is a null event, not a finite waiting time. Discrete values need not be integers: the source’s shoe-size example includes .
Probability mass functions
Each possible value is assigned a probability. The source calls the formula a probability function, probability mass function or probability distribution (and later “probability distribution function”). We use mass function to distinguish it from the cumulative function . As emphasized in the source’s Function note, the input is a numerical value and the output is its probability. A valid law satisfies and , summed over all possible values.
For the number of heads in three independent fair tosses:
| x | 0 | 1 | 2 | 3 |
|---|---|---|---|---|
Equivalently for , and zero elsewhere. The middle values combine three sequences each; they are not equally likely to the endpoints. Always check nonnegativity and total probability one before using a distribution.
Descriptive statistics: centre and spread
Mean, median and mode describe central tendency. Standard deviation measures spread; variance is its square and measures variability. Together these provide a descriptive summary rather than a complete account of a data set.
For an observed data list, the mode is the value occurring most often. Sort the observations in ascending or descending order to find the median: the middle observation for an odd count, or the average of the two middle observations for an even count. The source examples are:
| Data | Mode | Median |
|---|---|---|
| 1, 3, 3, 6, 7, 8, 9 | 3 | 6 |
| 1, 2, 3, 4, 5, 6, 6, 9 | 6 | |
| 1, 1, 1, 3, 4, 6, 8, 8, 8 | 1 and 8 | 4 |
For a discrete probability distribution, a mode maximizes . A median satisfies both and .
Qualify the printed parity shortcut. The source also prints for an even number of values, with and , and for an odd number.
Counting observations works for an empirical data list; counting distinct possible values of a non-uniform distribution does not determine its median. Use the two probability inequalities.
Example 7 has five possible values, yet its source answer is the midpoint of the full median interval .
When cumulative probability is exactly one half across a gap, the midpoint is a reporting convention, not the sole mathematical median.
Mean as a weighted long-run average
For data , . For a random variable with mass function , its mean or expectation is . With independent repetitions under a fixed distribution and a finite expectation, this is the long-run average interpretation. Infinite distributions require the appropriate convergence; symmetry alone does not guarantee an expectation exists.
The source scores one fair coin throw as for heads and for tails:
| x | 0 | 1 |
|---|---|---|
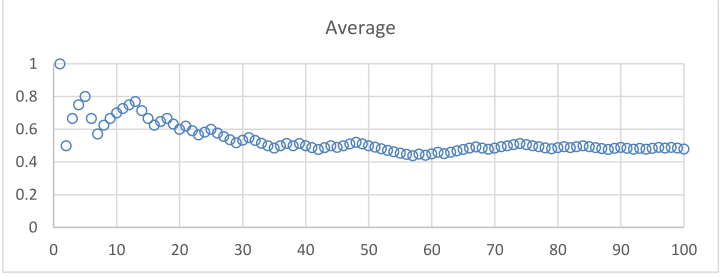
Repeat the experiment n times and plot the running average.
The Student copy provides blank axes; the Teacher copy completes one particular run, reproduced in the diagram below.
Its horizontal axis covers 0–100 tosses and its vertical average covers 0–1. The early averages fluctuate and later values settle near .
This one run illustrates the long-run mean ; it is not a claim that every run approaches monotonically or equals one half after a fixed number of tosses.
Constant and symmetric distributions: source proofs
If a is constant, its distribution places probability one at a:
| x | a |
|---|---|
| 1 |
Therefore .
For a finite distribution symmetric about , let . Then . With listed values, write them as . Expanding the source sum gives
Replace each negative-side probability by its equal positive-side probability. Every pair becomes , and the central term is zero, so . Since , shifting every value back by a gives . If only values are listed, insert the central value a with probability zero; the same cancellation applies. Follow the Teacher suggestion to use Example 8 to see the matching pairs explicitly.
Expectation of a function
For and mass function , , whenever the expectation exists. You may average g(x) using X’s masses without first constructing a separate Y table.
The source proof begins with n possible values:
| x | … | ||||
|---|---|---|---|---|---|
| … | |||||
| … |
Qualify the printed proof. Its assertion is valid when each image has just one preimage among the possible X values. Under that one-to-one condition, its full chain is .
For a general transformation the images may repeat, as in Example 5. Group first: . Then . This proves the same rule without the extra one-to-one restriction, while the original printed proof remains in the native transcription.
Variance describes spread around the mean
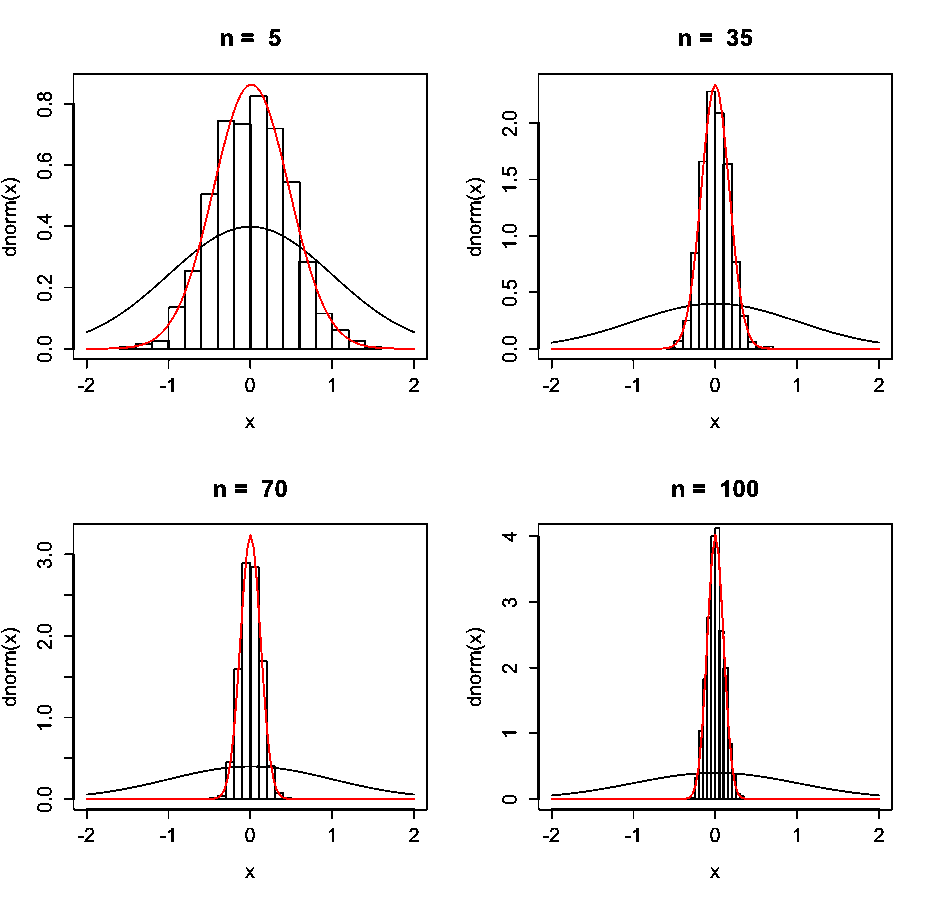
A mean locates the centre but does not describe the full shape or spread. The source’s four panels, labelled n=5,35,70,100, are reproduced below with their original histograms, red and black curves, x axes and different vertical scales. They are centred at zero but have different spreads. Compare horizontal concentration; the varying height scales are not a common probability scale. Source attribution printed in the PDF: University of Pennsylvania illustration.
For a discrete X with mean , the variance is the probability-weighted average squared distance from that mean:
The standard deviation is , taking the nonnegative square root. The source says “positive”; zero variance has standard deviation zero. These finite formulas apply when the second moment is finite.
The source’s alternative formula is . Retain every step of the proof:
The three sums in the fourth line are respectively , and . Constants have no variability: a variable equal to a with probability one has the one-column table , ; and . The source points ahead to Section 5, the appendix relating these probability-weighted formulas to the mean and variance of a frequency distribution from secondary school; use that connection to recognize the same weighted-average structure.
Linear transformations: complete source proofs
For constants a and b, if and , then and . The same choice of plus or minus is used throughout each expression. For discrete X with mass f(x), retain the expectation proof:
The last two sums are E(X) and 1 respectively. The variance proof uses that transformed mean:
The sum of squared deviations is Var(X). Adding or subtracting b cancels inside the deviation; scaling by a squares the distance multiplier. The standard deviation therefore scales by , a supplementary consequence that also handles negative a.
Calculator values: population spread and stored precision
The full seven-step Example 11 workflow enters probabilities as frequency weights. Use the population output σx and square its stored value to obtain variance. The source’s n=1 is the sum of those weights. Do not substitute the sample output Sx or retype a rounded sigma. Example 13 uses the same workflow before applying the transformation rules.
Independent observations and repeated trials
The source models an experiment repeated n times under identical conditions, such as repeated fair-die throws. X denotes one result and the respective first through nth results. They are modelled as independent and identically distributed observations of X. Identical conditions justify a common distribution in this model; independence is a separate assumption, not a consequence of the subscripts or the phrase “identical conditions”.
For n independent observations with the same finite moments, the source gives
and
The signs carry through the expectation, but all variance contributions are added. The source omits proofs because they use joint distributions and covariance, which it identifies as outside the syllabus.
Read the dependence remark as a restriction on using a rule. Even without independence, . The source prints for dependent variables. The precise statement is that adding their variances is not guaranteed; some dependent pairs can still have additive variances. The equality alone does not establish independence; its failure rules out independence when these variances exist.
Doubling one observation versus adding two independent observations
For two independent copies of X:
| Quantity | Double one observation | Add two independent observations |
|---|---|---|
| Expectation | ||
| Variance |
The source warning means these constructions are not interchangeable in general. With positive variance, their variances differ by a factor of two; a constant zero-variance case is a degenerate exception. Example 14 connects normalization and base moments to a transformation and an independent sum. Example 15 makes the independent outcome table explicit before comparing signed and absolute differences.
Appendix: from observed frequencies to a probability law
A fair die is tossed 20 times. The source data, in their original order, are:
5, 4, 5, 3, 6, 2, 1, 1, 6, 3, 3, 1, 6, 5, 1, 3, 2, 1, 3, 5.
(i) Find the mean and variance of this set of data. Method 1: use frequencies. Here denotes an observed frequency, rather than the probability-mass-function notation used earlier. Write and .
| Score | Frequency | Relative frequency | |
|---|---|---|---|
| 1 | 5 | ||
| 2 | 2 | ||
| 3 | 5 | ||
| 4 | 1 | ||
| 5 | 4 | ||
| 6 | 3 |
The source uses the variance with divisor n, not the unbiased sample-variance estimator with divisor n−1:
Equivalently, .
Method 2: use relative frequencies as an empirical probability distribution. Let be a value selected uniformly from these 20 recorded observations, so repeated scores receive their observed relative frequencies:
| 1 | 2 | 3 | 4 | 5 | 6 | |
|---|---|---|---|---|---|---|
| Empirical probability |
Therefore .
(ii) What happens to relative frequencies after many tosses, for example 10,000? Under repeated independent fair-die tosses, the relative frequency for each face approaches in the long-run probability model. This does not say all six counts are exactly equal after a particular finite number of tosses, or that each new toss makes the approximation better.
(iii) Connect the data calculation to expectation and variance. As n grows, the sample mean approaches the theoretical fair-die mean:
This is the sense in which the source calls expectation a limiting value of sample means. The population variance uses :
The source’s last line writes inside a variance sum weighted by the theoretical probabilities. Read this as a limiting connection: the empirical variance is , while the theoretical variance is centred at . The empirical values 3.3 and 3.21 from these 20 observations are not the true fair-die moments and . Both original copies are retained with the printed notation unchanged.
A running average from the printed coin experiment
Expand diagramFit diagram to page
Use the scrollbars or arrow keys to inspect details.
The same centre with different spreads
Expand diagramFit diagram to page
Use the scrollbars or arrow keys to inspect details.
Explore
For the same random variable X, compare Y=X+5 with Z=2X. Predict the changes in expectation, variance and standard deviation before calculating. Adding 5 shifts the distribution without changing its spread; doubling X doubles its standard deviation and multiplies its variance by 4. Explain why a variance has squared units, then check your prediction against the formulae.
Worked example
For taking and with probabilities and , and . Thus .
The expectation of X² is not generally the square of E(X).
Check your understanding
For the same , find and .
The expectation is ; the variance is .
Choose a practice question
Mastery checklist: after the lecture and again after the tutorial
Use the same checklist twice, matching the two checkpoints in the notes. For each item, explain the condition for using the rule and try an example without opening its working.
- Explain a random variable as a function assigning a real number to every outcome in the sample space. Distinguish a discrete random variable (finite or countable support) from a continuous one. Continuous variables are contrasted here; their density methods belong to later work.
- Tabulate a discrete probability law with , , and .
- Find every mode: a value x with the largest probability .
- Find a median m satisfying both and . The printed checklist uses inconsistently in this row; use the same candidate m for both tests. The earlier median discussion explains non-uniqueness and the midpoint convention.
- Calculate the mean .
- Calculate variance using or , then take the nonnegative square root for standard deviation .
- For , use , combining probabilities when constructing Y’s distribution if different x values give the same Y.
- Transform moments with and .
- For n independent observations of the same distribution, calculate and . Additivity of expectation itself does not require independence.
- For two independent variables X,Y with finite moments, use and . A minus sign does not subtract independent variances.
Choose practice by the skill you need
The notes’ complete question-type map is retained below with links to the actual questions. The part labels describe where to focus within each question. “First part” and “second part” retain the source’s unnumbered groupings; a dash means the source cell is blank.
| Skill/concept | Lecture examples | Discussion | Review problems |
|---|---|---|---|
| Normalize | 2(i), 3, 4 (first part), 12(i), 14(i) | 1, 5(i) | 1 (first part), 2(i), 5 (first part), 6 |
| Determine the probability distribution | 1, 5, 16(ii) | 1(iii), 2(ii), 3 (first part), 4(ii), 5(i), 7(ii) | 3, 6 (first part), 8(ii), 9(iii), 10(i), 11(ii) |
| Find and | 8, 9, 10, 11, 12(i)(ii)(iii), 14(ii), 15 (first part), 16(iii) | 2(ii), 3(ii)(iii), 4(iii), 5(ii), 6 (first part)(i) | 1, 2(ii), 3, 4, 5 (first part), 6(i) |
| Mean and variances of linear combinations | 13, 14(iii)(iv), 15(a)(b) | 5(iii), 6 (second part) | 3(i)(ii), 4, 5 (second part), 7(iii), 11(i) |
| Applications of expectation and variance | 17 | 7(iii), 8(ii) | 10(ii), 11(iii), 12 (second part) |
| Prior topic: Probability | 2(ii)(iii), 3(ii), 4 (second part), 16(i)(iv) | 1(i)(ii), 2(i), 3(i), 4(i), 6(ii), 7(i), 8(i) | 2(iii), 7, 8(i)(iv), 9(i), 12 (first part) |
| Prior topic: Conditional probability | — | 2(iii) | 3, 9(v) |
The printed map groups some questions broadly. For example, Example 3(ii) is a tail probability using a geometric progression, and Review 7(iii) needs the nonlinear area transformation . Follow the actual asks and conditions in the linked question, rather than assuming every entry in a row uses a single formula.
Complete discussion and review sets
The questions and short answer keys at the back of both lecture copies match the existing worked records. Use these links to try each question and then reveal its working. The original question pages and short keys are retained in the source record.
- Discussion: Question 1, Question 2, Question 3, Question 4, Question 5, Question 6, Question 7, Question 8.
- Review: Question 1, Question 2, Question 3, Question 4, Question 5, Question 6, Question 7, Question 8, Question 9, Question 10, Question 11, Question 12.
Discussion 4’s short key labels its final three values “(iv)” although the question ends at (iii); the linked working correctly associates them with the mean, expected squared deviation and variance.
Review 11 calls its dice “tetrahedral (8-sided)”; the eight stated face counts determine the model.
Review 12’s three beam panels are reconstructed beside its question, including both alternating stacks and the initial unbalanced beam. These source qualifications remain beside the worked records.
Practice questions
Practice section 1 · Questions 1–6
Sum two tetrahedral dice · Complete a distribution and read inequalities · +4 more
Practice section 2 · Questions 7–12
Use the midpoint convention for a median · Find a mean by symmetry and by summation · +4 more
Practice section 3 · Questions 13–18
Transform a mean and variance · Distinguish a transformed observation from two independent observations · +4 more
Practice section 4 · Questions 19–24
Separate the two-card stopping cases from the squared third-card scores · Count products with their multiplicities before calculating moments · +4 more
- Separate the two-card stopping cases from the squared third-card scores
- Count products with their multiplicities before calculating moments
- Put the squared deviation inside the expectation
- Normalise the parameterised distribution before transforming variance
- Distinguish a reflected distribution from dependent realised throws
- Count heads across the stopping rule before setting a fair fee
Practice section 5 · Questions 25–30
Separate disjoint prizes and subtract the entry fee once · Score three draws without replacement · +4 more
- Separate disjoint prizes and subtract the entry fee once
- Score three draws without replacement
- Normalise the maximum score and count three-round orderings
- Use a weighted difference grid for two independent totals
- Average absolute values and build the sum distribution
- Use the absolute deviation and avoid double-counting the double-two case
Practice section 6 · Questions 31–36
Follow the reroll rule and translate a difference into an absolute value · Take fourth moments when an area is proportional to the square · +4 more
- Follow the reroll rule and translate a difference into an absolute value
- Take fourth moments when an area is proportional to the square
- Respect the first-miss stopping rule before comparing rounds
- Retain the exceptional all-blue score in the conditional game
- Average the reciprocal score and distinguish gains from guesses
- Separate signed attack advantage from damage clipped at zero
Practice section 7 · Question 37
Count first-winning throws and distinguish payout from net gain
Ready to try this on your own?
For “Discrete random variables”, try a question without the working and explain your method. This records your confidence, saved in this browser only.