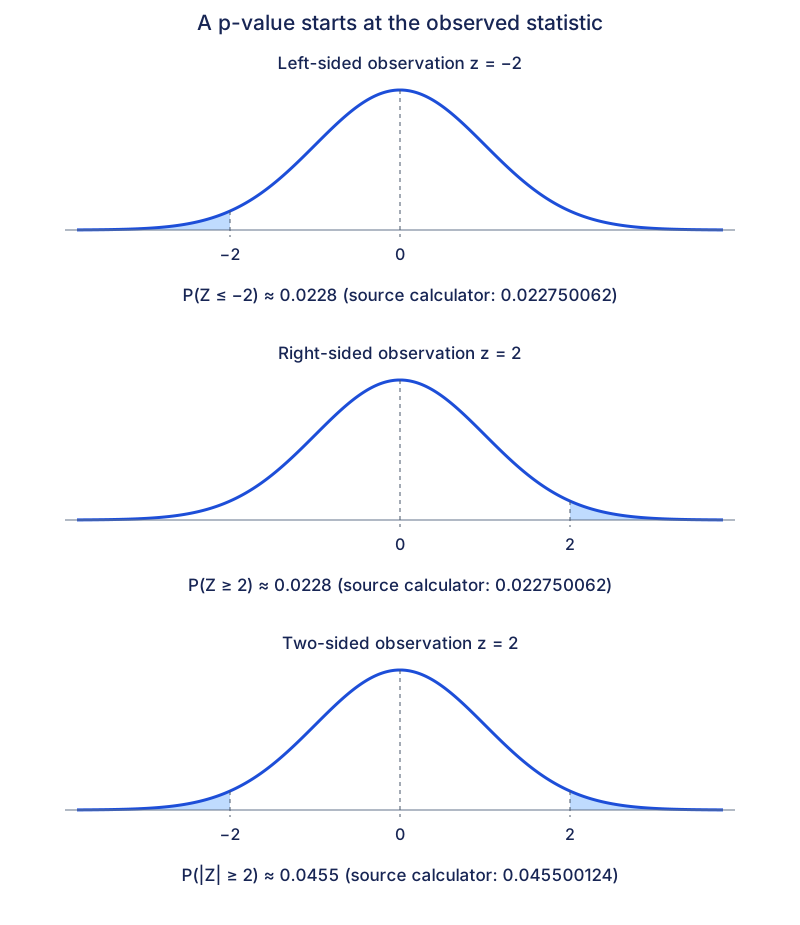
Back to readingHypothesis tests for a meanUse a p-value · DiagramsChoose another diagramObserved tail probabilitiesExpand diagramFit diagram to pageUse the scrollbars or arrow keys to inspect details.Three normal curves show observed tails beyond −2, beyond 2, and beyond both −2 and 2. One-sided probability is 0.0228; the two-sided total is 0.0455.Open original diagram (new tab)Next: Compare p-values and critical values at 5%Read all diagrams / printBack to reading