The normal distribution
← Back to lesson · Complete chapter reading and print view · Open reference notes separately
By the end, you can
- Standardise using the standard deviation
- Translate probability statements into tail areas
- Combine independent normal quantities
about 40 minutes for the lesson · practise at your own pace.
The central idea
For , has standard normal distribution. The second parameter is the variance; divide by its square root to standardise. Probabilities are areas under a continuous density, so P(X=x)=0. Linear combinations of independent normal variables remain normal, with variances adding after scaling.
Continuous values and probability density
The notes begin with values on a continuous scale. Waiting time in hours has support . A proportion can be modelled on , but in a fixed finite town the actual possible voting fractions are discrete; treating them as continuous is an approximation.
Height is treated as continuous when it can be measured to arbitrary accuracy. An exact height of 171 cm has probability zero under that model. A height rounded to 171 cm describes an interval, such as under the usual half-up convention, and can have positive probability. The source’s list includes 169.9 and 169.95; those do not round to 171 cm and are not valid examples of that rounded interval.
A density is non-negative and has total area one:
The density is usually defined on all real numbers and may be zero outside the model’s support. A single point has zero width: . Thus all four probabilities , , and are equal. The cumulative distribution function is
Read the normal model
Write , where μ is the mean, σ is the standard deviation and . Its density is
The notes discuss normal models for physical measurements, manufactured parts and measurement errors. Check the suitability of the model; a bell shape alone does not establish normality. “Gaussian” is another name used in the notes.
- The peak occurs at ; differentiating gives , positive before μ and negative after it.
- Symmetry about puts mean, median and mode at μ.
- The inflection points are . The curve is concave down between them and concave up outside them.
- As , . The Teacher specifically stresses the horizontal asymptote : tails do not stop at finite bounds.
- Total area under the density is one. Interval probabilities are areas, evaluated using the graphing calculator in these examples.
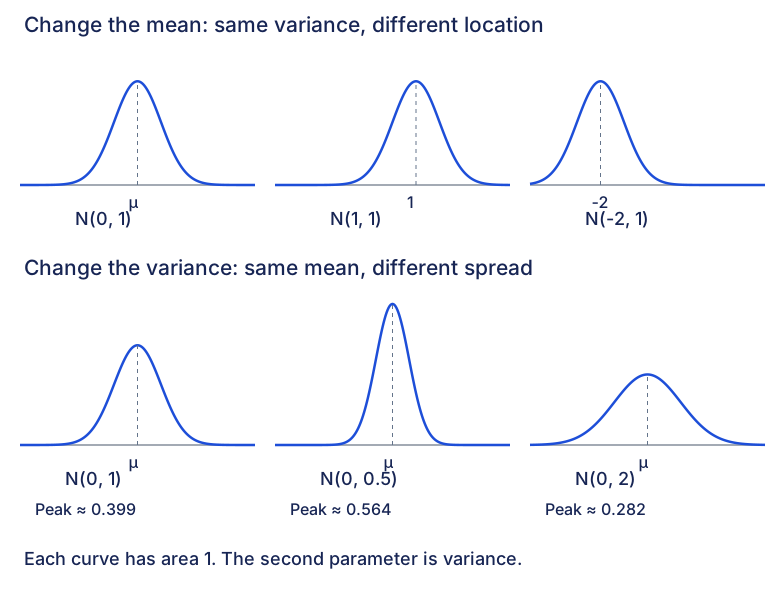
Changing μ shifts location while keeping variance fixed. The source uses , and . Changing variance changes spread: at mean 0, compare variances 1,0.5 and 2. Smaller variance gives a narrower, taller curve. The source’s last two spread plots have heights consistent with treating 0.5 and 2 as standard deviations; the accompanying figure here uses them as variances, as the printed notation requires.
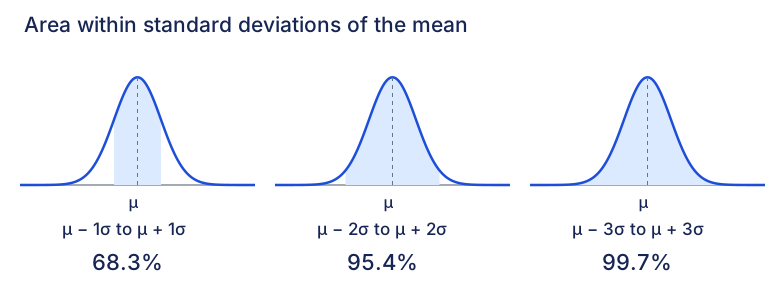
For a normal distribution, approximately 68.3%, 95.4% and 99.7% lie within respectively one, two and three standard deviations of μ. These are central areas, not density heights.
From the shaded area to the calculator
First simplify the inequality, then sketch its region and choose the calculator limits. The source uses normalcdf(lower, upper, μ, σ) to evaluate the density integral. Enter the standard deviation, not the variance. For the examples here, the source uses or to simulate an infinite tail to the required precision; those finite numbers are not mathematical infinity.
Example 1 compares interval, right-tail, left-tail and modulus events. Then try all three parts of Self-Practice 1 before opening the working.
Find a cutoff from a probability
The next examples reverse the calculation: the area is given, and the unknown is a boundary. Start with a rough sketch, decide which area is given, and use the standard deviation in invNorm.
For :
invNorm(p,μ,σ,LEFT)returns x with .invNorm(p,μ,σ,RIGHT)returns x with . A left-area-only command uses instead.invNorm(p,μ,σ,CENTER)returns two bounds and such that . The bounds must be symmetric about the mean. Each tail has area .
The retained calculator walkthrough uses the tail selector in its stated OS 5.2.2 interface, with STAT WIZARDS ON. If that selector is unavailable, use the equivalent left cumulative area; the probability model does not depend on the interface.
Example 2 contrasts left and right areas, followed by Self-Practice 2. Example 3 uses a central 80% area and both returned endpoints. Pause and think shows why a fixed lower endpoint may require a different route.
Solve a probability inequality using its boundary
The source’s distinction example asks for less than5%, so finding a quantile is only the first step. Find k satisfying the matching equality, then compare the proposed cutoff x with k on a sketch.
For , a normal lower cumulative area increases as its cutoff moves right; an upper-tail area decreases. The four strict forms are:
| Given condition | Boundary used | Required side |
|---|---|---|
Example 4 keeps the strict real-valued range and then identifies the smallest permissible one-decimal cutoff. The separate self-directed Example 4 retains the source’s repeated number.
Standard normal scores
A standard normal random variable has mean 0 and variance 1: . It is also called a standard score or z-score. Its density is
Standardisation expresses a value in standard deviations from its mean. It lets you compare relative standing in distributions with different spreads and helps solve for unknown μ and/or σ.
The notes ask whether scoring 60% in one test and 65% in another establishes better performance relative to peers.
Raw percentages alone do not: you need the tests’ means and standard deviations. The later source comparison develops this question; no missing data are invented here.
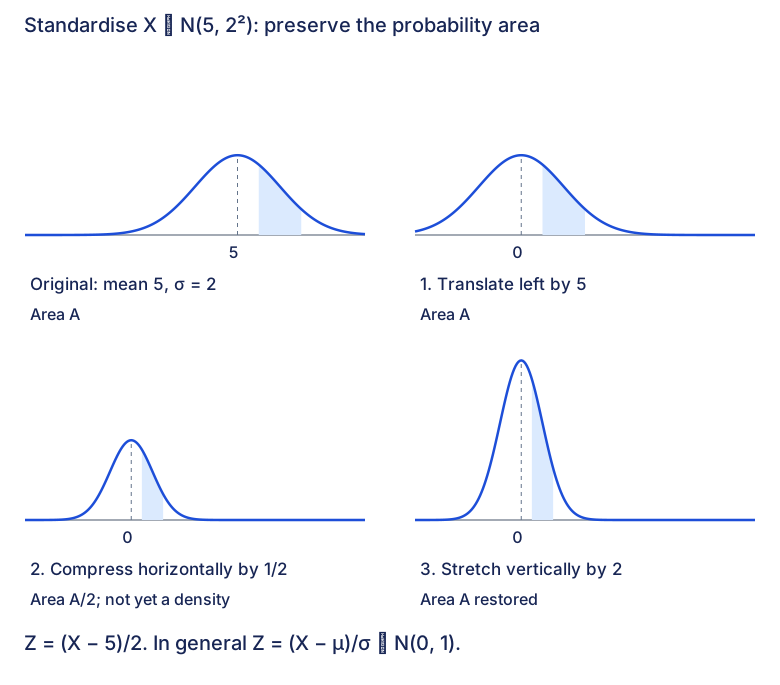
Derive the transformation: first X∼N(5,2²)
The original density is
- Translate five units left. Replace x with x+5:
The mean is now 0; the standard deviation remains 2.
- Compress horizontally by a factor 1/2. Replace x with 2 x in the translated function:
The width is now that of a standard normal, but the total area has halved. This intermediate curve is not yet a probability density.
- Stretch vertically by a factor 2. Equivalently replace y with y/2:
The area returns to 1, giving the standard normal density. The corresponding random variable is .
Generalise the three graph transformations
For the normal density with mean μ and standard deviation , use the same sequence:
- Translate parallel to the x-axis by −μ, replacing x with x+μ:
- Scale parallel to the x-axis by 1/σ, replacing x with σx in the translated expression:
- Scale parallel to the y-axis by σ, replacing y with y/σ:
The source’s graphical argument begins with an interval of area A. Translation leaves area A, with bounds and . Horizontal scaling gives bounds and but area A/σ. Vertical scaling multiplies that area by σ, restoring A. Thus
Both the horizontal and vertical scalings matter for a density graph. For the random variable, standardisation is simply ; it does not involve another random vertical variable.
Try Self-Practice 3, including the two-tail modulus event.
Confirm standardisation by integration
Define , with . The source next confirms the preserved area by substitution. Put , so and . The new limits are and .
Subtracting μ and dividing by positive σ also gives the same event directly:
The factor σ from the change in integration width cancels the density’s 1/σ factor. This is the algebraic counterpart of the earlier horizontal and vertical graph scalings. The definition of Z and this calculation establish its standard normal distribution; equality of probabilities alone is not being used to identify two arbitrary random variables on the same sample space.
Use quantiles to find unknown parameters
When μ and/or σ are unknown, the source standardises to before using the given tail probabilities. Example 5 gives one equation for an unknown mean; Example 6 gives two equations for μ and σ. Keep at least 5 significant figures in intermediate working and inspect the meaning of any rounded interval endpoints.
The test-score illustration returns to the earlier 60% versus 65% question with actual means and variances supplied by the source.
Transform one normal variable
For and a≠0,
Translation changes the mean but leaves variance unchanged. Multiplication by a changes variance by ; the standard deviation becomes . The source states the rule for any real a; when a=0, the result is a constant with variance 0, rather than a non-degenerate normal variable.
For the source’s proof, take with a>0. Its cumulative probability is
Set , so , and . As , ; at , . Then
This is the cumulative distribution of . For a<0, dividing the event inequality by a reverses its direction: . Accounting for reversed limits gives the density with positive scale and the same variance . The source calls these expressions “cumulative density”; they are cumulative distribution probabilities.
Combine independent normal variables
If X and Y are independent normal variables with respective means and variances , then
provided the resulting variance is positive. If both coefficients are zero, the combination is a constant. Subtraction changes the mean’s sign but adds the independent variances.
For independent observations , each ,
The complete source expectation/variance summary is:
| Property | Expectation | Variance |
|---|---|---|
| Constant a | ||
| Scale one variable | ||
| Scale and translate | ||
| Combine two variables | ; independence is not required | For independent X,Y: |
The source warns against applying the variance sum without independence. More precisely, independence is sufficient, and without it the omitted covariance term may matter:
Zero covariance can also make the variance sum valid; it alone does not establish that an arbitrary combination of marginally normal variables is normal. The independent-normal rule above supplies both the distribution and its variance.
One scaled observation or several observations?
The notes distinguish nX, n times one observation of one object, from , the sum of n independent observations from n objects. For n>1 and positive σ², their variances differ:
Words like “twice” or “thrice” usually mean scaling; “sum of” usually combines observations. Always inspect the actual objects and independence assumptions. The source’s translation reminder also follows from the table: shifting every value by the same constant changes the mean and leaves the variance unchanged.
Self-directed learning: normal approximation to a binomial
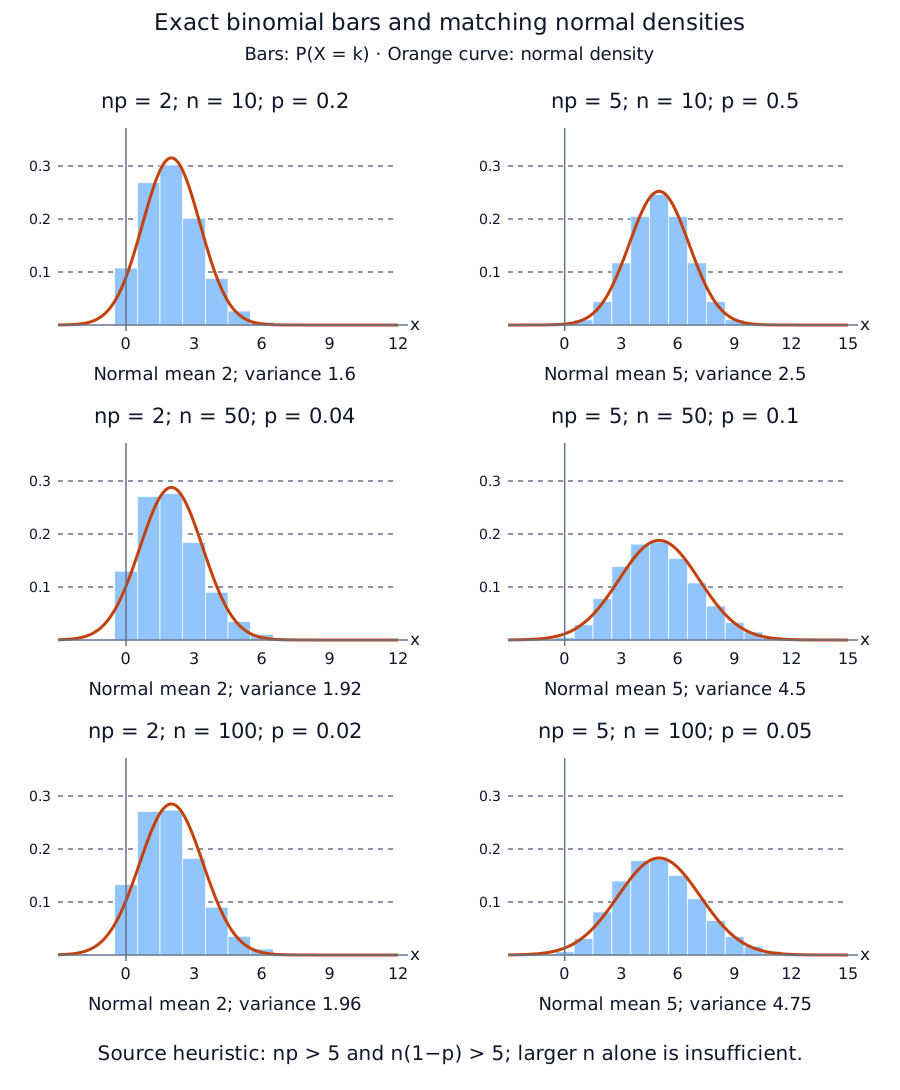
For the source compares binomial probability bars with a matching normal curve, keeping constant while increasing . Its six panels use or , each with . The reconstruction below calculates and overlays the density of . Binomial bar heights are point probabilities; a normal density height is not itself a point probability.
The source’s general rule is and . Keep the strict inequalities as printed. This is a practical approximation heuristic, not a universal accuracy guarantee, particularly for far tails. Increasing while holding a small fixed does not force a good normal approximation: the panels remain skewed. The panels are at the stated threshold, rather than satisfying .
Independently authored use note: for a count event, continuity correction aligns an integer bin with a continuous interval; for example, . Check the actual event and approximation quality rather than substituting a normal density value for a probability. Exact binomial probabilities remain available.
The printed optional resources are GeoGebra simulation and fixed-np exploration. These are retained source pointers; their remote contents have not been reviewed here.
Location and spread
Expand diagramFit diagram to page
Use the scrollbars or arrow keys to inspect details.
Areas within standard deviations
Expand diagramFit diagram to page
Use the scrollbars or arrow keys to inspect details.
Method map: Translate a normal event before calculating
Identify the model and its spread, keep the event when standardising, then match the calculation to the shaded area. An interval probability and a density height are different quantities.
Read the spread before entering a calculator value
In the variance convention N(μ, σ²), the second parameter is the variance. Standardisation requires a positive standard deviation.
Expand diagramFit diagram to page
Use the scrollbars or arrow keys to inspect details. The text explanation follows.
- Variance v is givenUse σ = √v
For a model , enter standard deviation 5. Do not enter 25 as the standard deviation.
- Standard deviation is givenUse it directly
For , the standard deviation is 6 and the variance is 36. Label the parameter rather than guessing from the size of the number.
Check that the normal model is stated or justified in context. A zero spread does not give a nondegenerate standard normal variable and cannot be used as the divisor here.
Transform every cutoff and preserve the event
Define Z from the same variable X. Subtract the mean and divide every bound by the positive standard deviation; the inequality directions stay unchanged.
- Left or right tailKeep the shaded side
The event becomes ; the event becomes . A right-tail event does not turn into a left-tail event merely because the variable is standardised.
- Between two boundsTransform both endpoints
For , set and . The event is , with the same probability. With a nondegenerate normal model, including an individual endpoint does not change that probability.
The source density stages have areas , , , then . Horizontal compression of a drawn density alone changes its area; the compensating vertical stretch restores a normalised density. Compare the four stages and their labelled areas in the source figure.
Choose an area calculation or an inverse cutoff
Decide whether the unknown is a probability or a cutoff. Sketch the shaded region and name the calculator's area convention before using it.
- Known cutoffsCalculate the probability of the event
For a standardised cutoff z, a left area is and a right area is . For the standardised interval , use . For a direct normalcdf calculation, use the original bounds with μ and σ, or the standardised bounds with mean 0 and standard deviation 1. Do not mix those two parameter sets.
- Known one-sided probability pMatch the inverse to the tail
For , a lower-tail-only inverse uses p for a stated left area and 1−p for a stated right area. When a standard-normal inverse returns z, recover the original cutoff with . An inverse supplied with the original μ and σ already returns the original cutoff. An interface with an explicit RIGHT selector may instead use the right area directly; do not complement it twice.
- Known central probability pUse symmetry only when justified
For a central interval symmetric about the mean and , the lower-tail endpoint areas are and . CENTER returns endpoints, not the half-width. An arbitrary interval is not determined by its area alone.
Check whether a cutoff should be above or below the mean and substitute back into the original event. Keep full calculator precision until the final requested rounding. A density height is not a probability.
Try a worked example
Read a case, make a prediction, then reveal the reasoning. The examples keep their stated values.
A large right area gives a cutoff below the mean
The source gives and . Before calculating, predict which side of 100 contains b.
Show reasoning
1. Identify the spread and shade the stated area
The standard deviation is 6, not the variance 36. More than half the curve lies to the right of b, so b is below the mean.
2. Complement only for a lower-tail interface
A RIGHT-tail interface can use the given 0.770 directly. A lower-tail-only inverse uses the complementary area 0.230. Both describe the same cutoff.
3. Recover the cutoff and check its direction
Keep calculator precision until the source’s final rounding to three significant figures. The result is below 100 as predicted.
A central interval has two endpoints and one half-width
The source gives and . Find the central interval, then distinguish its endpoints from the half-width a.
Show reasoning
1. Expand the event and split the remaining area
The standard deviation is the positive square root of 25, namely 5. The interval has probability 0.8 and its bounds are symmetric about 70, so the remaining 0.2 splits into tails of 0.1.
2. Use lower-tail areas 0.1 and 0.9
A CENTER interface returns the pair of endpoints; the two lower-tail inverse calculations return the same pair. Neither returned endpoint is a itself.
3. Find the half-width separately
Either endpoint gives the same half-width. The source reports a = 6.41 and interval limits 63.6 and 76.4, all to three significant figures. Retain the full endpoint values until rounding.
Compare with the density transformation
Expand diagramFit diagram to page
Use the scrollbars or arrow keys to inspect details.
Six source binomial-to-normal comparisons
Expand diagramFit diagram to page
Use the scrollbars or arrow keys to inspect details.
Explore
Independent masses X and Y each follow . Compare X+Y with 2X. Predict their centres, spreads and probabilities of lying between 194 and 206 before calculating. Sketch both distributions on common axes, then check using their standard deviations in a normal probability calculation. Explain what represents two independently selected objects and what represents two copies of one measurement.
Worked example
If , its standard deviation is . . For , and .
Subtracting independent variables still adds their variances; subtracting the same variable from itself is a different situation.
Check your understanding
A measurement X is modelled as normal, with unknown mean and standard deviation. It has and . Estimate both parameters and find the upper cutoff exceeded by 5% of measurements. State the lower-tail probabilities used and verify your fitted parameters against both original statements.
The corresponding lower-tail probabilities are 0.10 and 0.80, with standard scores approximately −1.2815516 and 0.8416212. Thus:
- 40 = μ − 1.2815516σ
- 65 = μ + 0.8416212σ
Subtracting gives a standard deviation of approximately 11.775 and then a mean of approximately 55.090. For the upper 5% cutoff, use lower-tail probability 0.95 and standard score approximately 1.6448536. The cutoff is mean + 1.6448536 × standard deviation, approximately 74.458.
Using the unrounded parameters, standardising 40 and 65 recovers the two original scores, hence lower-tail probabilities 0.10 and 0.80. The second is equivalent to upper-tail probability 0.20. Keep full calculator precision until the final rounded estimates.
Mastery learning objectives
At the end of this chapter, I should be able to:
Choose a practice question
The source’s two checkpoints are after lecture and after tutorial. Its full question map is retained below; a blank cell is blank in the source. The two combination bullets share one printed reference cell.
| Common question type | Lecture examples | Discussion | Review problems (follow up) |
|---|---|---|---|
| Decide whether is a suitable model | 2 | 3(i) | |
| Find or a related probability given | 1, 4 | 1, 3(first part), 6, 7(a), 9(first part) | 1(i), 2(ii), 3(ii), 5(ii), 6(i), 10(i)&(ii) |
| Find given a probability, | 2, 3 | 6 | 5(i), 7(i), 8(i) |
| Use standardisation to solve for and/or | 5, 6 | 3(second part), 4, 5 | 3(iii), 5(i), 8(i), 9(i), 10(iii), 11(i) |
| Linear combinations of independent normals; sums of independent identically distributed normals | 7, 8, 9, 10 | 7(b)–(e), 8, 9, 10, 11, 12, 13 | 1(ii)(iii), 2(i)(iii), 3(iv), 4, 5(first part), 6(iii), 7(iii), 8(ii), 9(ii)(iv)(v)(vi), 10(iv), 11(ii) |
| Prior topic: Binomial Distribution | 7(ii), 9(iii) |
For independent , the map gives . For independent identically distributed observations, . Retain the chapter’s qualifications for zero variance, dependence and the distinction between a sum and .
- Direct probabilities: Example1
- Inverse tails: Example2
- Central interval: Example3
- Strict cutoff: Example4
- Unknown parameters: Examples5–6
- Scaling and sums: Example7
- People and lift loads: Example8
- Fruit prices: Example9
- Height models and assumptions: Example10
- Discussion questions
- Review problems
Additional lecture-only Review12: maximise an interval probability is printed after the source map and is not listed among its original routes.
Practice questions
Practice section 1 · Questions 1–6
Translate intervals and tails into normal probabilities · Practise interval, left-tail and central probabilities · +4 more
Practice section 2 · Questions 7–12
Find the range of distinction cutoffs · Use the standard normal model directly · +4 more
Practice section 3 · Questions 13–18
Scale one observation or combine independent variables · Distinguish two children from twice one child · +4 more
Practice section 4 · Questions 19–24
Use the lower-tail quantile to set the new filling mean · Convert both rejection rates into quantile equations · +4 more
- Use the lower-tail quantile to set the new filling mean
- Convert both rejection rates into quantile equations
- Locate the mean midway between equal normal tails
- Allow an interval endpoint on either side of the fixed bound
- Choose between scaling one value and adding independent values
- Distinguish six separate rods from three times one rod
Practice section 5 · Questions 25–30
Add a fixed box mass and retain both at-least-one methods · Separate contents, packaging and independent packet sums · +4 more
- Add a fixed box mass and retain both at-least-one methods
- Separate contents, packaging and independent packet sums
- Compare an intersection event with the larger total-price event
- Preserve the absolute deviation when relating two normal tails
- Keep the square-root growth in the large-sample tail
- Compare two runners and distinguish a sum from a multiple
Practice section 6 · Questions 31–36
Scale fruit masses before combining independent prices · Use the given variances and the central eighty percent · +4 more
- Scale fruit masses before combining independent prices
- Use the given variances and the central eighty percent
- Keep both tails of a call-duration difference and all handling fees
- Keep a strict probability condition strict at the quantile boundary
- Condition on the total length before interpreting two short pickles
- Find a central height interval and a large-sample tail limit
Practice section 7 · Questions 37–41
Recover a component normal distribution from a sum of two observations · Keep the instructed rounded model consistent with later probabilities · +3 more
- Recover a component normal distribution from a sum of two observations
- Keep the instructed rounded model consistent with later probabilities
- Interpret a probability inequality as a range of mass thresholds
- Square the coefficient of a two-packet total and retain both tails
- Maximise a normal interval probability by choosing its mean
Ready to try this on your own?
For “The normal distribution”, try a question without the working and explain your method. This records your confidence, saved in this browser only.