Porisma
Back to reading

The normal distribution

The normal distribution · Diagrams

Choose another diagram

Six source binomial-to-normal comparisons

Expand diagram

Use the scrollbars or arrow keys to inspect details.
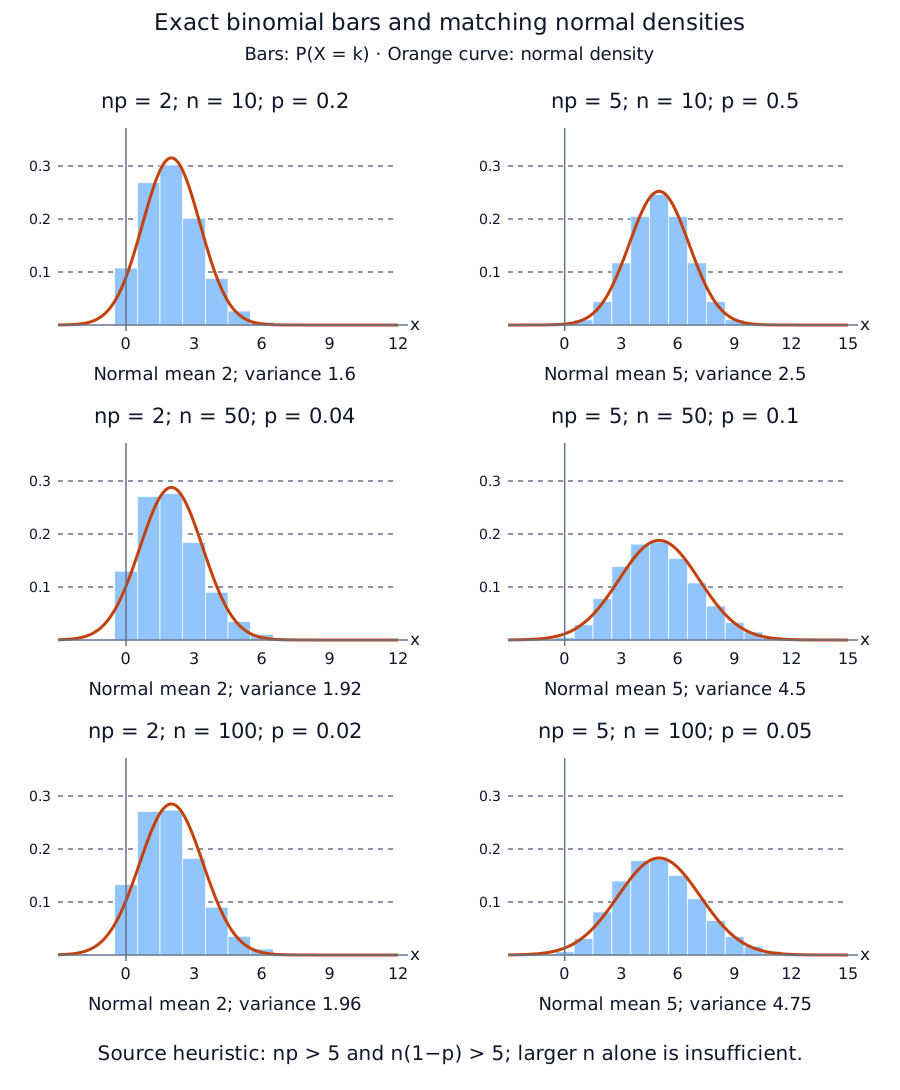
Six reconstructed panels compare exact binomial probability bars with the normal density having the same mean and variance: np=2 or 5 and n=10,50,100. Keeping small np fixed while increasing n leaves skewness; the source heuristic requires both np and n(1−p) strictly greater than 5.
Open original diagram (new tab)
Back to reading