Worked solution
Sketch the eleven insulin and time observations
The source records the time for blood sugar to return to normal after insulin was injected into a diabetic patient.
| Insulin (milli-units) | Time (minutes) |
|---|---|
| 40 | 4.10 |
| 60 | 4.07 |
| 95 | 3.98 |
| 100 | 3.90 |
| 125 | 3.81 |
| 160 | 3.75 |
| 180 | 3.72 |
| 210 | 3.77 |
| 240 | 3.63 |
| 260 | 3.57 |
| 500 | 3.30 |
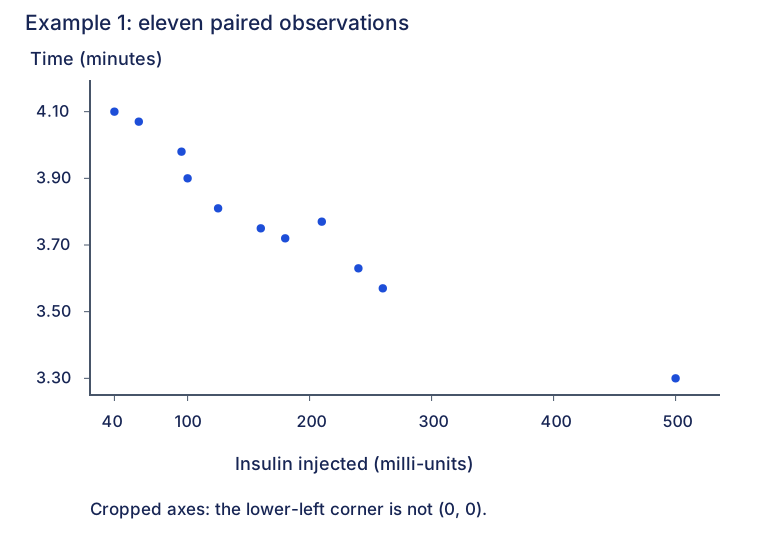
Sketch a scatter diagram with insulin injected as the independent variable. Give a brief description of any observed pattern.
CJC · Lecture · Example 1
Use the six-step calculator procedure
Answer
Use insulin in L1, time in L2, an enabled scatter Plot1, ZoomStat and Trace.
- Press STAT and select 1:Edit.
- Enter insulin values in L1 and the corresponding time values in L2, in the same row order.
- Press 2nd, then Y= to open statistical plots.
- Press ENTER for Plot1, select ON, and choose the first graph-type icon (scatter). Set Xlist=L1, Ylist=L2.
- Press ZOOM, then 9:ZoomStat to fit all observations into the window.
- Press TRACE. Use left/right arrows to move between observations and check the displayed coordinates.
These are the six printed procedure steps; the menu screenshots’ mathematical inputs are retained in text. For example, the first pair is (40,4.10), not an insulin value paired with another row’s time.
Check the scatter sketch
Answer
Eleven points; x is insulin (40–500 milli-units), y is time (3.30–4.10 minutes).
The supplied sketch plots all eleven observations. Label both axes and the extreme data values. The figure here uses cropped, explicitly nonzero axes and no fitted line. The original marks its lower-left corner O even though the time scale is cropped; do not read that corner as the true point (0,0). Check the nearby points carefully: time rises from 3.72 at 180 to 3.77 at 210, then falls again.
Describe the observed pattern
Answer
Overall, time tends to decrease as the insulin amount increases: a negative association.
This describes the observed sample; it does not mean that every successive pair decreases or establish a causal rule from the scatter alone. The visible Student page leaves the description space blank, while the retained PDF text contains a decreasing-time sentence. That native-versus-visible distinction is recorded: the explanatory completion here is checked directly against all eleven data pairs.
Compare your sketch
Expand diagramFit diagram to page
Use the scrollbars or arrow keys to inspect details.
Common mistakes
Keep both lists in paired order. A cropped plot corner need not be the origin; a negative overall association need not decrease at every successive point.
Solution notes
The only supplied lecture copy is labelled Student. Its six-step calculator table and scatter sketch are visibly printed; its pattern-description answer is present in native extraction but not visibly filled in the page render. All originals are retained without claiming a Teacher comparison.