Worked solution
Fit both regression directions and recover the means
Eight pairs of observations are given below.
| 16 | 7 |
| 13 | 17 |
| 16 | 12 |
| 15 | 11 |
| 16 | 18 |
| 12 | 10 |
| 17 | 17 |
| 15 | 12 |
(i) Find the regression line of on .
(ii) Find the regression line of on .
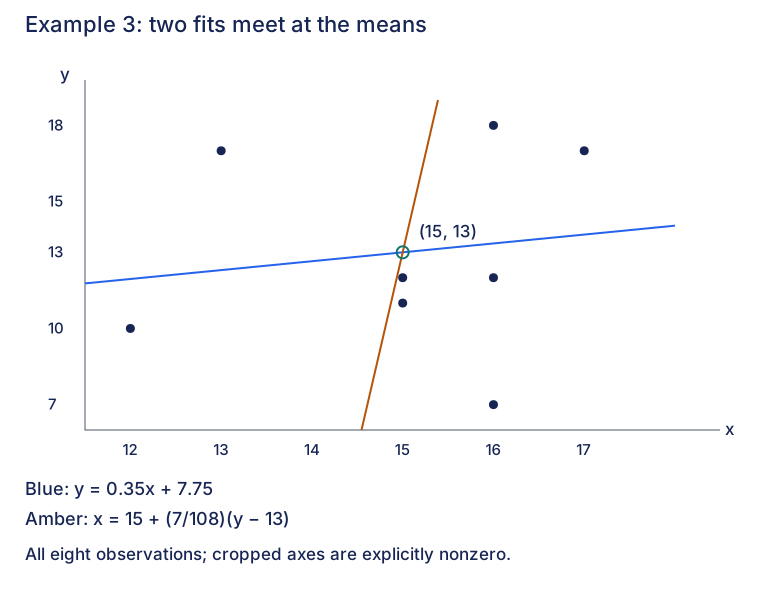
(iii) On a scatter diagram, sketch the two regression lines.
Use your answers in (i) and (ii) to find and .
CJC · Lecture · Example 3
(i) Regress y on x
Answer
.
For a small dataset the source gives a home-screen alternative to STAT Edit: enter {16,13,16,15,16,12,17,15} STO→ L1 and {7,17,12,11,18,10,17,12} STO→ L2. Use curly braces, comma-separated values, STO→, then 2nd 1 for L1 or 2nd 2 for L2. Preserve the paired order.
Press STAT → CALC → 8:LinReg(a+bx). Set Xlist=L1, Ylist=L2. Enter Y1 in Store RegEQ using ALPHA TRACE 1, highlight Calculate, then ENTER. Y1 retains this fit for the sketch. The display gives , , and . Here the calculator’s x and y match the question variables: is the intercept and the gradient.
Independently, and give and .
(ii) Swap the input and response lists
Answer
(3 s.f.).
Again select STAT → CALC → 8:LinReg(a+bx), but set Xlist=L2, Ylist=L1, highlight Calculate, then ENTER. The calculator’s displayed x now represents the question’s and its displayed y represents the question’s . Write the result with the original variables in their correct roles.
The printed output is , , with the same and . Hence , or the source’s 3-s.f. form . Independently, and . Keep the exact or full-precision values for later calculations; do not invert the first fitted line.
(iii) Plot all pairs and both fitted lines
Answer
The shallow -on- line and steep -on- line meet at .
- Press 2nd Y= to open STAT PLOTS.
- Press ENTER for Plot1; select ON, scatter type, Xlist=L1, Ylist=L2 (the source uses a square marker and blue colour).
- Press Y=. Y1 already contains . To plot the reverse fit on these same axes, make the subject and enter it in Y2: . The source screen uses ; use stored full coefficients or to avoid rounding effects.
- Press ZOOM → 9:ZoomStat to include all observations and both fits.
- Press TRACE, using left/right arrows to see each observation’s coordinates at the screen bottom.
The printed sketch labels observed extrema and , with a cropped lower-left O; this does not mean the plotted corner is the true origin. Its blue caption prints , omitting . The earlier equation and calculator screen correctly show ; the reconstruction uses that equation. Its reverse-line caption is rounded to , while this plot uses exact coefficients. All eight points are preserved.
Use the two fitted equations to find the means
Answer
, (3 s.f.).
Both lines pass through . Solve their full-precision equations together:
Substitution gives , then . The source’s calculator intersection procedure is 2nd TRACE → 5:intersect, then ENTER for the first curve, ENTER for the second curve and ENTER for the guess. Its display is approximately , reported as to 3 s.f. Small display errors come from stored rounding, not different means.
The unnumbered final ask specifically requires the regression lines. The source offers two checks when that restriction does not apply: calculate the arithmetic means directly, and ; or use STAT → CALC → 2:2-Var Stats, Xlist=L1, Ylist=L2, Calculate → ENTER, then scroll through the statistics. The printed totals are , , , , , , with sample standard deviations , and population standard deviations , . These independently recover the same means.
Compare your sketch
Expand diagramFit diagram to page
Use the scrollbars or arrow keys to inspect details.
Common mistakes
Swapping the input lists changes the regression direction. The reverse regression is not obtained by inverting the first regression, and its rounded equation should not be used for a precision intersection.
Solution notes
Student-only source. All printed calculator procedures, mathematical outputs, both fits, the sketch and the unnumbered means task are retained. The missing x in the printed blue sketch caption is explicitly corrected using the earlier printed equation. No marks are printed.