Worked solution
Correct recorded marks and compare the scatter
The average weekly study hours and corresponding test marks of ten students are recorded below.
| Student | ||
|---|---|---|
| A | 24 | 6 |
| B | 17 | 30 |
| C | 20 | 40 |
| D | 41 | 76 |
| E | 52 | 96 |
| F | 23 | 46 |
| G | 46 | 90 |
| H | 17 | 35 |
| I | 15 | 26 |
| J | 29 | 57 |
(i) Calculate the product moment correlation coefficient between and .
(ii) Determine the least-squares regression line of on .
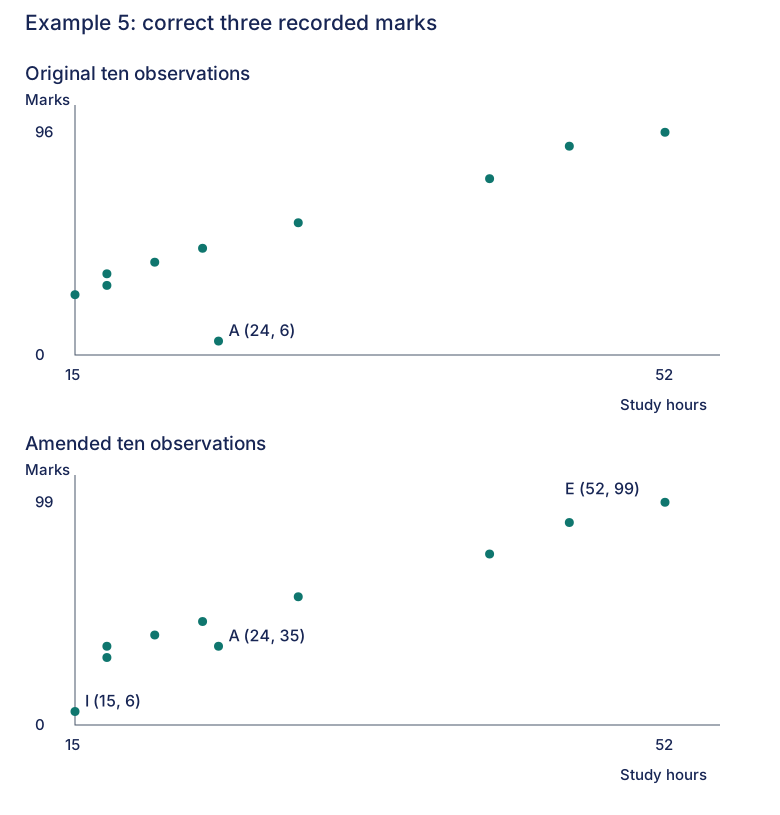
(iii) Three marks were wrongly recorded: A should receive 35, I should receive 6, and E should receive 99. Using appropriate diagrams, comment on how these changes affect (a) the gradient of the regression of on and (b) the correlation coefficient.
CJC · Lecture · Example 5
(i) Obtain correlation from the paired lists
Answer
(3 s.f.).
Follow all five source steps: STAT → 1:Edit; enter study hours (explanatory ) in L1 and test marks (response ) in L2; STAT → CALC → 8:LinReg(a+bx); set Xlist=L1 (2nd 1) and Ylist=L2 (2nd 2), then highlight Calculate; press ENTER. The screen gives , , , .
In MODE, set STAT DIAGNOSTICS to ON; otherwise and may be absent from the output even though the regression coefficients are shown. The standalone answer space is blank, but the coefficient is printed in the calculator screen; the 3-s.f. reporting here is authored.
(ii) Read coefficient roles correctly
Answer
(3 s.f.).
For 8:LinReg(a+bx), is the intercept and is the gradient. Thus the full screen equation is .
The source also permits 4:LinReg(ax+b). That option labels the gradient and intercept . Both options give the same fitted line, to 3 s.f.; only the coefficient names change. Preserve the equation form rather than copying the letter names without checking.
(iii)(a) Compare original and amended diagrams
Answer
The corrected positive regression line is steeper.
Replace A’s point by , I’s point by , and E’s point by . Keep all ten students. The source says the new data “removes the outlier point”, meaning that the old A coordinate is replaced, not that student A is deleted. The smallest-hour observation moves down and the largest-hour observation moves up, giving the source’s steeper positive trend.
The diagrams retain every pair and label the corrected observations. An independent numerical check, not required by the printed graphical ask, gives a new slope compared with .
(iii)(b) Compare clustering about a line
Answer
The new is closer to .
The corrected scatter is more tightly clustered around a rising straight-line trend. This is the source’s graphical justification. An independent check gives after correction, compared with before correction. A steeper slope by itself does not imply a stronger correlation; the scatter’s closeness to a line supplies the separate reason.
Compare your sketch
Expand diagramFit diagram to page
Use the scrollbars or arrow keys to inspect details.
Solution notes
All source calculator menu/list/diagnostics/coefficient-role remarks retained. The printed graphical conclusions are preserved. Corrected-data coefficients are explicitly independent checks, not claimed as printed answers. No marks printed.