Worked solution
A reciprocal area and the endpoint choice
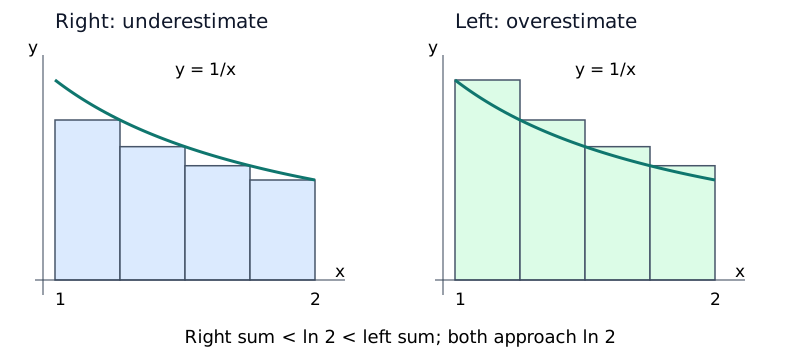
Example 2 (Self-Reading). The graph on has rectangles of equal width, using right endpoints. Show that their total area is and find the exact value of . Teacher check: construct a similar diagram using left endpoints.
CJC · Lecture · Example 2
Right-endpoint sum
The width is . Right endpoint has height . Multiplying by the width gives rectangle area , so .
Exact limit
The rectangles converge to the area .
Left-endpoint construction
At each for , draw a horizontal top to the next partition point and vertical sides down to the axis. The first height is and first area is , as the Teacher notes. The left total is . Since decreases, the left rectangles overestimate and the right rectangles underestimate: . Both limits are .
Compare your sketch
Expand diagramFit diagram to page
Use the scrollbars or arrow keys to inspect details.
Common mistakes
Right endpoints do not always overestimate: here the curve decreases, so they underestimate.