Worked solution
Match slope and concavity intervals on a cubic graph
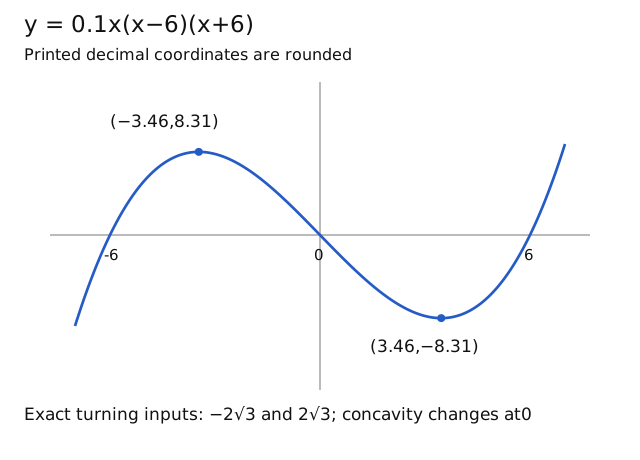
Using the given graph of , match (a) strictly increasing, (b) strictly decreasing, (c) concave upwards and (d) concave downwards to the printed sets: ; ; ; .
Expand diagramFit diagram to page
Use the scrollbars or arrow keys to inspect details.
CJC · Lecture · Example 4
(a) Strictly increasing
Match to the fourth printed set: or , using the graph’s rounded labels. The Teacher arrow connects (a) to this last choice. Independently, is positive for or . These are the exact open intervals; 3.46 is a rounded boundary, not an exact derivative root.
(b) Strictly decreasing
Match to the first printed set: as displayed on the source graph. The exact derivative-sign interval is . The Teacher arrow links (b) to the first choice. Do not turn the rounded bound into an exact assertion about inputs between 3.46 and .
(c) Concave upwards
Match to the third printed set: . The Teacher arrow is horizontal from (c) to this choice. The independent check agrees.
(d) Concave downwards
Match to the second printed set: , following the Teacher arrow. Here . The printed turning coordinates are and ; exact values are and . The original graph also marks x-intercepts .
Common mistakes
The sets are shuffled matching choices. Slope and concavity use different derivatives; graph decimals are rounded.
Solution notes
Both originals visually compared. Complete source working and distinct Teacher guidance integrated; independently authored domain/precision qualifications are identified. No printed marks or past-paper attribution.