Worked solution
Find the mean and variance of defective-part counts
Three parts from a production line are sampled and tested. Let count the defective parts, with distribution
| 0 | 1 | 2 | 3 | |
|---|---|---|---|---|
| 0.51 | 0.38 | 0.10 | 0.01 |
Find the mean and variance of .
CJC · Lecture · Example 11
Find the mean first
. Thus .
Method 1: average the squared distances
Use . The complete source table is
| 0 | 1 | 2 | 3 | |
|---|---|---|---|---|
| 0.51 | 0.38 | 0.10 | 0.01 | |
.
Method 2: subtract the squared mean
Use . From the same four probabilities, . Hence .
Method 3: use the probability-weighted calculator workflow
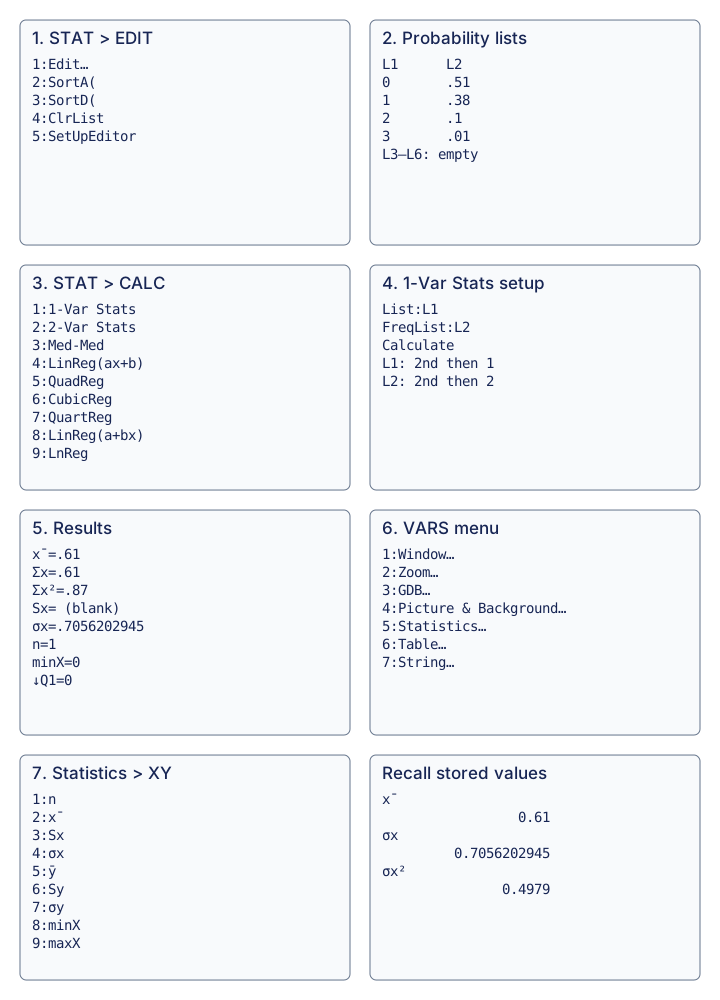
Use the graphing calculator as the source’s third method for Example 11:
- Press STAT, then 1:Edit, to enter the distribution.
- Put in L1, and the corresponding probabilities in L2.
- Press STAT, choose CALC, then 1:1-Var Stats.
- Set List:L1 and FreqList:L2. Obtain L1 with 2nd, 1 and L2 with 2nd, 2.
- Highlight Calculate and press ENTER. The printed screen shows , , , , , minX=0 and Q1=0; Sx is blank. Scroll down for more statistics.
- To avoid retyping a rounded value, press VARS, then 5:Statistics.
- Choose 2: x̄ for the mean or 4: σx for the population standard deviation. Recall the stored and square it: the displayed is the variance. The source explains that this workflow supplies standard deviation rather than variance directly.
Use σx, not Sx. Here the frequency weights are probabilities and sum to one, so the printed n=1 is the total weight, not one observed defective part. The source’s squared stored value avoids premature rounding. The diagram retains the meaningful source menu and screen contents.
Compare your sketch
Use probability weights to find a mean and variance
1. Enter outcomes and their probabilities
Press STAT, then 1:Edit. Put the outcomes in L1 and their probabilities in L2, keeping each pair on the same row.
Enter outcomes and their probabilities L1 · outcome L2 · probability 0 0.51 1 0.38 2 0.10 3 0.01 2. Use the probabilities as weights
Open STAT → CALC → 1:1-Var Stats. Select L1 as List and L2 as FreqList, then Calculate. To enter L1 press 2nd then 1; for L2 press 2nd then 2.
- List
- L1
- FreqList
- L2
3. Read the mean and population standard deviation
The weighted mean is x̄ = 0.61. Use σx, the population standard deviation, for this probability distribution. The displayed n = 1 is the total probability weight, not a sample size.
x̄ = 0.61; σx ≈ 0.7056202945
4. Square the stored standard deviation
Open VARS → 5:Statistics → XY. Recall σx and square the stored value, rather than retyping a rounded display.
σx² = 0.4979
The source leaves Sx blank. Do not use a sample standard deviation here. An exact check is E(X²) − [E(X)]² = 0.87 − 0.61² = 0.4979.
View original calculator screens
Expand diagramFit diagram to page
Use the scrollbars or arrow keys to inspect details.
Common mistakes
E(X²) is not [E(X)]². Retain the supplied distribution; no independent-defect or binomial assumption is required to use this probability table.
Solution notes
The calculator continuation on PDF 15–16 is integrated as Method 3; probability weights and population sigma are distinguished from sample statistics.