Worked solution
Choose a model with a limiting daily rate
The daily rate charged by a car-hire firm varies with the length of the hire period. The firm’s brochure gives the following data.
| Hire period, days | 1 | 2 | 3 | 4 | 5 | 10 | 30 | 50 |
|---|---|---|---|---|---|---|---|---|
| Daily rate, dollars | 149 | 119 | 115 | 112 | 109 | 105 | 103 | 101 |
Calculate the value of the product-moment correlation coefficient. marks
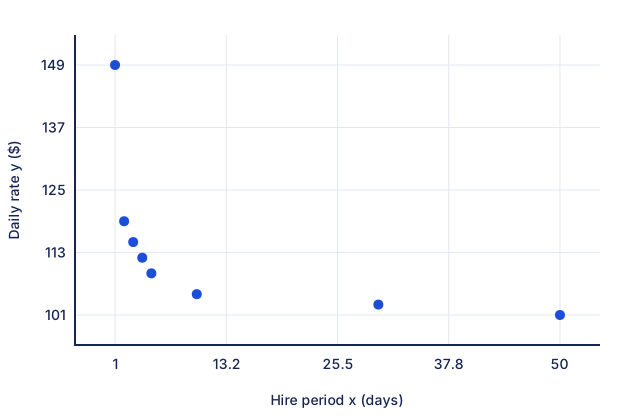
Give a sketch of the scatter diagram for the data, as shown on your calculator, and hence
(i) comment on the value of the product-moment correlation coefficient,
(ii) state, with a reason, which of the following models is appropriate.
A: ; B: ; C: ; D: . marks
For the appropriate model, calculate the least squares estimate of and , and verify that, for the transformed data, the product-moment correlation coefficient is close to 1. marks
[2006/SP/II/7]
CJC · Review problems · Question 1
Answer
; model C; , ; .
Correlation and scatter diagram
Enter all eight pairs without transforming . The product-moment coefficient is . Plot the eight table pairs with hire period on the horizontal axis and daily rate on the vertical axis; see the comparison sketch. The rate drops rapidly initially, then levels off. The relationship is negative and curved; is not close to , so the original coordinates do not give a close negative linear fit.
(ii) Select the model
Model C, , allows the daily rate to approach a finite limiting value as . This matches the levelling-off pattern and the context of a daily hire rate.
Fit the transformed data
Put and regress on . With and , obtain and . Thus , (3 s.f.). The correlation of and is , close to .
Compare your sketch
Expand diagramFit diagram to page
Use the scrollbars or arrow keys to inspect details.
Common mistakes
A strong curved relationship can have a coefficient far from ±1. The positive transformed correlation is between 1/x and y, not x and y.
Solution notes
The source calls the original relationship “weak negative linear”. The numerical coefficient and curved scatter are retained; strength labels have no universal cutoff.