Correlation and linear regression
Practice section 4 of 6
Questions 19–24 in this collection
Practice questions
Discussion practice · 1 of 6
Compare pollution models and audit a damaged regression fragment
(a) Traffic engineers compare traffic flow on a busy main road with air pollution at a nearby monitoring station. Each hour, sensors report the average traffic flow (vehicles per hour) for the preceding hour; the station supplies a pollution reading in a suitable unit, with higher readings indicating more pollution. A random sample of eight hours gives:
| 1796 | 1.0 |
| 1918 | 2.2 |
| 2120 | 3.5 |
| 2315 | 4.2 |
| 2368 | 4.3 |
| 2420 | 4.5 |
| 2588 | 4.9 |
| 2850 | 5.5 |
(i) Draw the scatter diagram, labelling the axes.
Two proposed models are and .
(ii) Find the correlation coefficient between (a) and , and (b) and .
(iii) Use (i) and (ii) to explain which model is better.
(iv) Find a suitable regression equation and use it to estimate when .
(v) Comment on the validity of the headline “Heavy traffic causes air pollution” in light of these results.
(b) A partly destroyed research paper retains these statements: the mean of is 4.4; the regression of on is ; the regression of on begins . Calculate the missing constant at the end of the second equation.
[2017/JJC/II/10]
CJC · Discussion · Question 6
Solution
Discussion practice · 2 of 6
Recover a missing price index and choose the prediction direction
The consumer price index measures average price changes in a fixed basket of consumption goods and services commonly purchased by resident households over time. It is commonly used as a measure of consumer price inflation. In the 2013 Singapore household expenditure survey, housing and food made up about half of the average monthly expenditure of an average household.
The table shows housing and food price indices from 2005 to 2012, with 2005 as the base period (index 100). For example, food index 104.6 in 2007 means average food prices increased by 4.6% from 2005 to 2007.
| Year | Housing price index | Food price index |
|---|---|---|
| 2005 | 100 | 100 |
| 2006 | 100.7 | 101.6 |
| 2007 | 102.3 | 104.6 |
| 2008 | 116.8 | 112.6 |
| 2009 | 123.1 | 115.2 |
| 2010 | 124.3 | 116.8 |
| 2011 | missing | 120.3 |
| 2012 | 148 | 123.1 |
(i) Show that the missing housing price index for 2011 is 136 (nearest integer), given the regression of on is , correct to 5 significant figures.
(ii) Draw the scatter diagram, labelling the axes clearly. Comment on the suitability of the linear model.
(iii) Estimate the housing price index in 2016 when the food price index is 134.6. Find an appropriate regression equation for and and use it for the estimate. Explain why this estimate might not be reliable.
(iv) Find the product moment correlation coefficient between and .
(v) It would be convenient to tabulate and instead. Without further calculations, explain whether the correlation between and differs from (iv).
[2017/MJC/II/9]
CJC · Discussion · Question 7
Solution
Discussion practice · 3 of 6
Compare used-car prices with reciprocal mileage
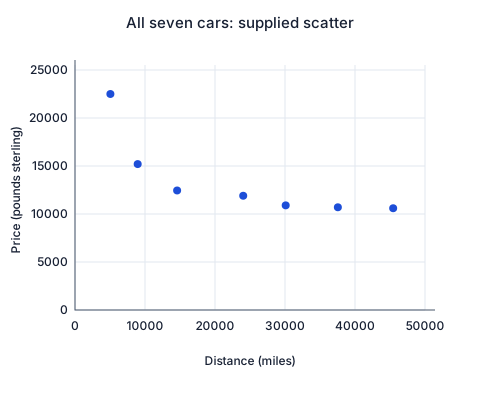
Adriana investigates how used-car prices depend on distance driven. A UK website lists seven cars of the same make and model; distance is in miles and price is in pounds sterling.
| (miles) | (pounds sterling) |
|---|---|
| 14588 | 12450 |
| 8954 | 15200 |
| 24030 | 11900 |
| 37551 | 10700 |
| 45452 | 10600 |
| 30100 | 10900 |
| 5055 | 22500 |
The source supplies the scatter diagram shown here and the correlation coefficient .
(a) What conclusion should Adriana reach about the relationship between and ? Justify your answer.
(b) Would the coefficient differ if distances were converted to kilometres and prices to Singapore dollars? Use the given conversions: 1 mile = 1.6 kilometres; 1 pound sterling = 1.7 Singapore dollars.
Adriana discovers that the car with and is a special version with a bigger engine and many extra features.
(c) Explain why this special car should not be used in the analysis.
For the rest of the question, exclude this special car.
(d) Use a reciprocal transformation to sketch against . Draw a line of best fit by eye.
(e) Mark the distances used to obtain the least-squares regression of on . Explain why these distances are squared and why the method is called least squares.
(f) Use your calculator to find this least-squares regression equation and the corresponding correlation coefficient.
(g) Estimate the price of an ordinary car of this make and model that has travelled 5055 miles. Explain whether the estimate is likely to be reliable.
Expand diagramFit diagram to page
Use the scrollbars or arrow keys to inspect details.
CJC · Discussion · Question 8
Solution
Discussion practice · 4 of 6
Compare fuel-consumption models using squared residuals
Abi and Bhani measure fuel consumption (kilometres per litre) for a car driven at different constant speeds (kilometres per hour).
| 40 | 22 |
| 45 | 20 |
| 50 | 18 |
| 55 | 17 |
| 60 | 16 |
(i) Abi models the data with .
(a) On graph paper, draw a scatter diagram of the data and the line .
(b) For a fitted line , the source describes the residual at as the vertical distance between and . Mark each residual on the diagram.
(c) Calculate the sum of squared residuals for Abi’s line.
(d) Explain why, in general, the sum of squared residuals is used instead of the sum of residuals.
Bhani uses a line through and . The sum of squared residuals for Bhani’s line is 1.
(ii) State, with a reason, which model gives a better fit.
(iii) Cerie carries out a similar experiment on a different car. Her fitted line has a sum of squared residuals of 0. What can you deduce about her data points?
[N2019/II/10(modified)]
CJC · Discussion · Question 9
Solution
Review practice · 5 of 6
Choose a model with a limiting daily rate
The daily rate charged by a car-hire firm varies with the length of the hire period. The firm’s brochure gives the following data.
| Hire period, days | 1 | 2 | 3 | 4 | 5 | 10 | 30 | 50 |
|---|---|---|---|---|---|---|---|---|
| Daily rate, dollars | 149 | 119 | 115 | 112 | 109 | 105 | 103 | 101 |
Calculate the value of the product-moment correlation coefficient. [2]
Give a sketch of the scatter diagram for the data, as shown on your calculator, and hence
(i) comment on the value of the product-moment correlation coefficient,
(ii) state, with a reason, which of the following models is appropriate.
A: ; B: ; C: ; D: . [4]
For the appropriate model, calculate the least squares estimate of and , and verify that, for the transformed data, the product-moment correlation coefficient is close to 1. [3]
[2006/SP/II/7]
CJC · Review problems · Question 1
Solution
Review practice · 6 of 6
An outlier reverses the fitted trend
A chemical is sprayed onto various plots of land. After a year the concentration, , of the chemical is measured in each plot, and also the concentration, , of bacteria in the plot. Both and are measured in appropriate units. A statistician is given the following data to analyse.
| 5.11 | 6.17 | 4.71 | 4.15 | 3.87 | 2.72 | 10.13 | 5.44 | |
|---|---|---|---|---|---|---|---|---|
| 4.23 | 3.98 | 4.81 | 6.30 | 7.82 | 9.45 | 11.71 | 4.15 |
(i) Calculate the correlation coefficient, and the line of regression of on . [3]
(ii) Give a sketch of the scatter diagram for the data, as shown on your calculator. Giving a reason, identify a data pair which should be regarded as suspect. [3]
(iii) Remove the suspect data pair, and calculate the correlation coefficient, and the line of regression of on , for the revised data. [2]
(iv) Comment of your answers to part (i) and (iii). [2]
Two other plots of land, A and B, are to be sprayed with the chemical. The value of for A is to be 1.2 and the value of for B is to be 4.95.
For each of these two plots, find the estimated value of , using the line of regression obtained in part (iii), and state, with a reason in each case, whether it would be good practice to regard this value as a valid prediction. [4]
CJC · Review problems · Question 2