Worked solution
An outlier reverses the fitted trend
A chemical is sprayed onto various plots of land. After a year the concentration, , of the chemical is measured in each plot, and also the concentration, , of bacteria in the plot. Both and are measured in appropriate units. A statistician is given the following data to analyse.
| 5.11 | 6.17 | 4.71 | 4.15 | 3.87 | 2.72 | 10.13 | 5.44 | |
|---|---|---|---|---|---|---|---|---|
| 4.23 | 3.98 | 4.81 | 6.30 | 7.82 | 9.45 | 11.71 | 4.15 |
(i) Calculate the correlation coefficient, and the line of regression of on . marks
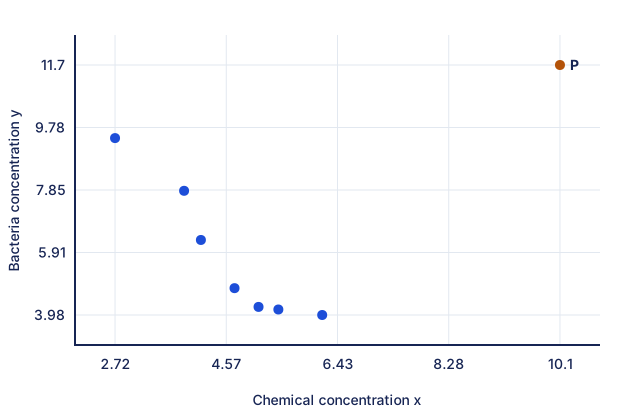
(ii) Give a sketch of the scatter diagram for the data, as shown on your calculator. Giving a reason, identify a data pair which should be regarded as suspect. marks
(iii) Remove the suspect data pair, and calculate the correlation coefficient, and the line of regression of on , for the revised data. marks
(iv) Comment of your answers to part (i) and (iii). marks
Two other plots of land, A and B, are to be sprayed with the chemical. The value of for A is to be 1.2 and the value of for B is to be 4.95.
For each of these two plots, find the estimated value of , using the line of regression obtained in part (iii), and state, with a reason in each case, whether it would be good practice to regard this value as a valid prediction. marks
CJC · Review problems · Question 2
Answer
All data: , . Omit : , . A: , unreliable extrapolation; B: , reasonable interpolation.
(i) Use all eight pairs
. Regressing on gives , or (3 s.f.).
(ii) Inspect the scatter
Plot all eight pairs. The point is distant from the other seven and does not follow their decreasing trend, so it is the suspect pair. The comparison sketch retains it and labels it P.
(iii) Refit without the suspect pair
For the remaining seven pairs, and , or (3 s.f.).
(iv) Compare the fits
The full data give a positive coefficient only , whereas the seven-point data have a strong negative linear association. The outlier changes both the sign and magnitude of the fitted trend.
Predict for A and B
Use the unrounded revised line. For A, . This extrapolates below the revised range , so it is not a reliable prediction. For B, . This is interpolation within that range, with close to 1, so it is a reasonable prediction under the fitted model.
Compare your sketch
Expand diagramFit diagram to page
Use the scrollbars or arrow keys to inspect details.
Common mistakes
An unusual point is a reason to investigate the observation, not a general licence to delete inconvenient data. Here part (iii) explicitly asks for removal.
Solution notes
The printed prompt says “Comment of”; wording retained. The solution on PDF 3 refers to part (ii) when discussing the revised fit; the intended reference is part (iii).