Worked solution
Recover a missing price index and choose the prediction direction
The consumer price index measures average price changes in a fixed basket of consumption goods and services commonly purchased by resident households over time. It is commonly used as a measure of consumer price inflation. In the 2013 Singapore household expenditure survey, housing and food made up about half of the average monthly expenditure of an average household.
The table shows housing and food price indices from 2005 to 2012, with 2005 as the base period (index 100). For example, food index 104.6 in 2007 means average food prices increased by 4.6% from 2005 to 2007.
| Year | Housing price index | Food price index |
|---|---|---|
| 2005 | 100 | 100 |
| 2006 | 100.7 | 101.6 |
| 2007 | 102.3 | 104.6 |
| 2008 | 116.8 | 112.6 |
| 2009 | 123.1 | 115.2 |
| 2010 | 124.3 | 116.8 |
| 2011 | missing | 120.3 |
| 2012 | 148 | 123.1 |
(i) Show that the missing housing price index for 2011 is 136 (nearest integer), given the regression of on is , correct to 5 significant figures.
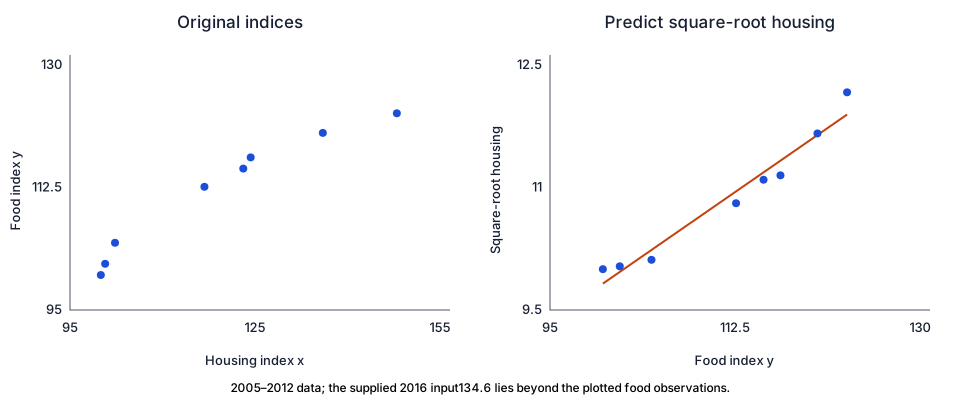
(ii) Draw the scatter diagram, labelling the axes clearly. Comment on the suitability of the linear model.
(iii) Estimate the housing price index in 2016 when the food price index is 134.6. Find an appropriate regression equation for and and use it for the estimate. Explain why this estimate might not be reliable.
(iv) Find the product moment correlation coefficient between and .
(v) It would be convenient to tabulate and instead. Without further calculations, explain whether the correlation between and differs from (iv).
[2017/MJC/II/9]
CJC · Discussion · Question 7
(i) Use the mean point, not the single missing observation
Answer
(nearest integer).
A regression line passes through ; it need not pass through every observation. The seven known housing indices sum to 815.2 and all eight food indices sum to 894.2. Write the missing housing value as . Then
Hence , which rounds to 136. The supplied coefficients are rounded to five significant figures; this recovery is correspondingly approximate. Substituting only the 2011 food value into the line would incorrectly assume zero residual for that observation. Use the requested recovered integer for the remaining parts.
(ii) Inspect the original price-index scatter
Answer
The original scatter is increasing but shows curvature; a straight line is only an approximation.
Plot housing index horizontally and food index vertically, retaining all eight pairs and using 136 for 2011. The gradient appears to decrease as housing index rises. This curved pattern makes a single linear model less suitable than the high positive association alone might suggest. The comparison diagram also shows the transformed variables used in (iii).
(iii) Predict the housing index from food index
Answer
; estimated housing index .
The known predictor is food index and the desired response is . Fit on , rather than algebraically reversing the regression of on . Retaining full precision gives , where
The printed rounded equation is . Using the retained coefficients,
The input 134.6 exceeds the observed food-index range 100–123.1, so this is extrapolation. The observations cover 2005–2012, while the target is 2016; the relationship may change over time. The positive transformed relationship does not guarantee a reliable future prediction.
(iv) Correlate food index with the square root of housing index
Answer
(3 s.f.).
Keeping all eight pairings and the recovered 136 gives , matching the printed key 0.979. This is correlation between and , not between the original and .
(v) Apply invariance under positive rescaling
Answer
The coefficient is unchanged: to 3 s.f.
Since , . The new variables are therefore the old transformed variables multiplied by the positive constants and . Positive rescaling changes their units but leaves their correlation unchanged; no recalculation is needed.
Compare your sketch
Expand diagramFit diagram to page
Use the scrollbars or arrow keys to inspect details.
Solution notes
All five printed asks, eight years and paired indices, missing entry, five-significant-figure given regression and printed key retained. Missing index recovered from the mean point; complete working and two scatter panels authored. Prediction uses regression of square-root housing on food. No printed marks.